
- Title
-
Knockdown of zebrafish Nanog increases proliferation of primordial germ cells during early embryonic development
- Authors
- Wang, H., Liu, Y., Ye, D., Li, J., Liu, J., Deng, F.
- Source
- Full text @ Dev. Growth Diff.
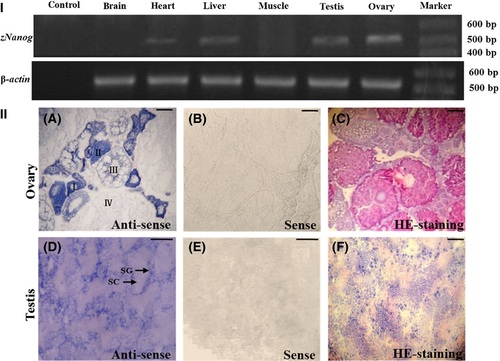
The expression of zNanog mRNA in adult zebrafish tissues. (I) The expression analysis of zNanog mRNA in various tissues using reverse transcription-polymerase chain reaction (RT-PCR) analysis. RNA template and β-actin were used as negative and internal controls, respectively. The zNanog mRNA was expressed in the ovary, testis, heart, and liver, but not in the muscle or brain. (II) The expression analysis of zNanog mRNA via in situ hybridization of ovary and testis cryosections. (A) zNanog mRNA was detected from stage I to II oocytes and was diminished in stage III oocytes, but was not observed in stage IV oocytes. (D) The expression of zNanog mRNA was detected mainly in the periphery of the seminiferous lobules in testis. (B and E) Sense probe. (C and F) HE staining. I: stage I oocyte, II: stage II oocyte, III: stage III oocyte, IV: stage IV oocyte, SG: spermatogonia, SC: spermatocytes. Scale bars: 0.5 mm in all panels. EXPRESSION / LABELING:
|
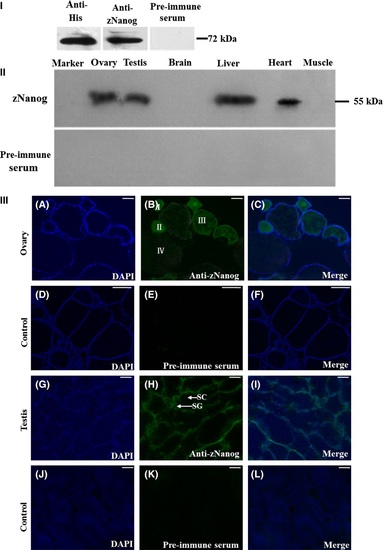
The expression of zNanog in adult zebrafish tissues. (I) Western blot analysis of the His-tagged zNanog fusion protein probed with the anti-His antibody, anti-zNanog antibody or pre-immune serum, respectively. (II) Western blot analysis of zNanog in zebrafish tissues. The zNanog protein was expressed in the ovary, heart, testis, and liver, as detected by a single band of 55 kDa, but not in the muscle or brain. Pre-immune serum was used as a negative control. (III) The expression of zNanog in the zebrafish ovary and testis. The localization of zNanog in the ovary and testis cryosections was detected by immunofluorescence analysis (A-F: ovary; G-L: testis). A, D, G, and J: DAPI staining; B and H: zNanog polyclonal antibody and the secondary green fluorescent antibody; E and K: pre-immune serum and the secondary green fluorescent antibody; C, F, I, and L: Merge. I: stage I oocyte, II: stage II oocyte, III: stage III oocyte, IV: stage IV oocyte, SG: spermatogonia, SC: spermatocytes. Scale bars: 0.5 mm in all panels. EXPRESSION / LABELING:
|
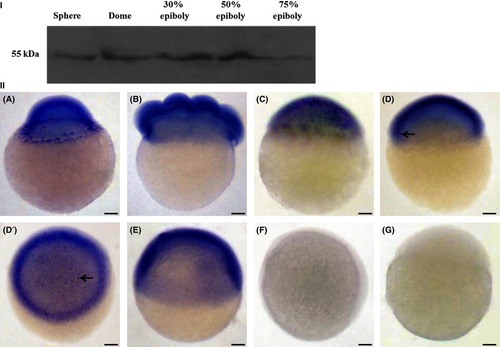
The spatial distribution of zNanog mRNA during early embryogenesis. Whole-mount in situ hybridization was performed with zNanog anti-sense probes. A: 1-cell (lateral view), B: 8-cell (lateral view), C: 1000-cell (lateral view), D: 30% epiboly (lateral view), D′: 30% epiboly (top view), E: 50% epiboly (lateral view), F: 70% epiboly (lateral view), G: negative control of embryo of 1000-cell (other stages not shown).Scale bars: 0.5 mm in all panels. |

The expression of zNanog in PGCs in 30% epiboly stage embryos. (I) zNanog and Vasa mRNA co-localized in the cytoplasm of PGCs in the 30% epiboly stage embryos by in situ fluorescence hybridization. zNanog and Vasa mRNA co-localized in the cytoplasm of PGCs in the 30% epiboly stage embryo cells. A and E: DAPI staining, B: Vasa RNA probes (green), C: zNanog RNA probes (red), F: Vasa sense probes, G: zNanog sense probes, D: merged of A-C, H: merge of E-G. Scale bars: 1.0 mm in A, B, C, D panel; 0.7 mm in E, F, G, H panel. (II) zNanog and zNanos co-localized in the PGC nuclei of the 30% epiboly stage embryos by fluorescent immunohistochemistry analysis. zNanog and zNanos co-localized in the nuclei of PGCs in the 30% epiboly stage embryos. A-D: zNanog and zNanos were stained using a primary polyclonal antibody against zNanog from rabbit (the secondary antibody: FITC-conjugated anti-rabbit) and against zNanos from mouse (the secondary antibody: Cy3-conjugated anti-mouse). A: DAPI staining, B: zNanog (green), C: zNanos (red), D: merge of A-C; E-H: The pre-immune sera from the rabbit and mouse were used as primary antibodies, and the signal was not observed. H: merge of E-G. Scale bars: 0.5 mm in all panels. EXPRESSION / LABELING:
|

Depletion of zNanog by MO-zNanog increases the Vasa-positive cells and Vasa mRNA expression in embryos. (I) Analysis of proliferation and localization of Vasa positive cells in MO-zNanog embryos by whole mount in situ hybridization. Scale bars: 0.5 mm in all panels. A-D′: The MO-zNanog embryos (A: sphere stage, B: dome stage; C: 30% epiboly stage, D and D′: 50% epiboly stage). E-H′: The wild type embryos. A-D and E-H: Top views. D′ and H′: Lateral views. (II) Numbers of Vasa-positive cells in embryos as detected by whole mount in situ hybridization using Vasa probes. Histogram representing the numbers of Vasa-positive cells in MO-zNanog and wild type embryos of the sphere, dome, 30% epiboly, and 50% epiboly stages. n represents the total numbers of embryos from three different experiments. *P < 0.05; **P < 0.005. (III) qRT-PCR analysis of Vasa expression in the different stages of MO-zNanog and wild type embryos. Sphere, dome, 30% epiboly, and 50% epiboly stages from each bar graph represents the ratio of relative gene expression related to β-actin (internal control). The data represent the means ± SD (error bars).*P < 0.05; **P < 0.005. EXPRESSION / LABELING:
PHENOTYPE:
|