
- Title
-
Gfap-positive radial glial cells are an essential progenitor population for later-born neurons and glia in the zebrafish spinal cord
- Authors
- Johnson, K., Barragan, J., Bashiruddin, S., Smith, C.J., Tyrrell, C., Parsons, M.J., Doris, R., Kucenas, S., Downes, G.B., Velez, C.M., Schneider, C., Sakai, C., Pathak, N., Anderson, K., Stein, R., Devoto, S.H., Mumm, J.S., Barresi, M.J.
- Source
- Full text @ Glia
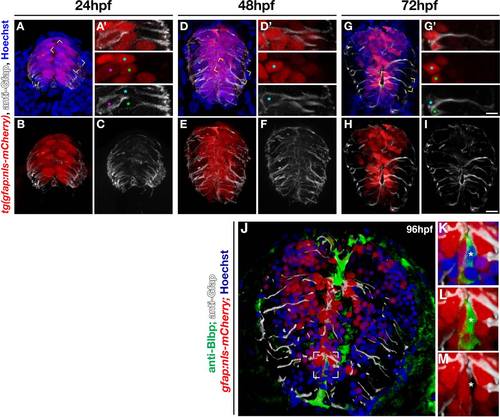
The gfap:nls-mCherry transgene labels radial glial nuclei. (A-I) Maximum intensity projections showing cross sections of 24, 48, and 72 hpf gfap:nls-mCherry embryos, immunolabeled with anti-Gfap (white) for radial glia and Hoechst (blue) for nuclei. (A′, D′, G′) Magnified, single optical slices of individual cells in the yellow boxed area in A, D, G. Colored asterisks match nucleus with radial body. (J) Transverse section of a 96 hpf spinal cord from a gfap:nls-mCherry embryo colabeled for anti-Blbp (green), anti-Gfap (white), and nuclei (Hoechst, blue). (K-M) Higher magnification of boxed area in K with separated fluorescent channels (K, all channels; L, mCherry, Gfap, Blbp; M, mCherry and Gfap). Scale bar in G = 5 µm; scale bar in I = 10 µm. |

gfap+ radial glia coexpress neural stem markers. (A-C) Cross sections of 24, 48, and 72 hpf double transgenic gfap:nls-mCherry;-3.9nestin:GFP embryos labeled with anti-Gfap (white) and anti-GFP to visualize nestin+, gfap+ radial glial populations. (D-F) Cross sections of 24, 48, and 72 hpf gfap:nls-mCherry embryos immunolabeled with anti-Sox2 (green) and anti-Gfap (white). Scale bar = 10 µm. (D′-E3) Enlarged views of yellow-boxed areas comparing ventral Sox2+ nuclei in panels D′, E′, F′ with ventral nls-mCherry+ nuclei in panels D3, E3, F3. Sox2+, mCherry negative nuclei were outlined for clarity. Scale bar = 5 µm (G) Quantification of the total number of Sox2+ cells present at all time points. (H) Quantification of the percentage of total Sox2+ nuclei that are nls-mCherry+ (red) throughout neural development. Numbers above each population represent the total number of cells assayed per time point. (I) Cross section of a gfap:nls-mCherry embryo treated with BrdU at 24 hpf, fixed at 48 hpf, and labeled for anti-Sox2 (green) and anti-BrdU (cyan). Scale bar = 10µm. (I′-I3′) Enlarged view of yellow-boxed area in panel I, with ventral Sox2+, nls-mCherry negative cells outlined for clarity. Asterisks denote ventral Sox2+/nls-mCherry- cells that are BrdU+. Scale bar = 5µm. (J) Quantification of the percentage of Sox2+ populations positive for BrdU at all time points. Sox2+/nls-mCherry+ cells are shown in red, and Sox2+/nls-mCherry negative cells are depicted in white. |
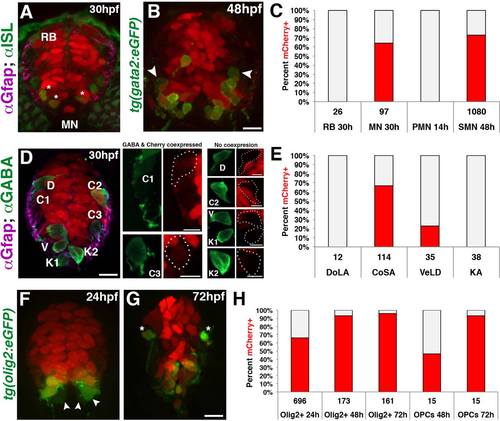
Fate mapping of gfap-expressing radial glia in the spinal cord. (A) Cross section of a 30 hpf gfap:nls-mCherry embryo immunolabeled with anti-Islet-1 (ISL), showing nls-mCherry is absent in RB sensory neurons but present in a subpopulation of MNs (asterisks). (B) Cross section of a 48 hpf gfap:nls-mCherry;gata2:eGFP embryo showing secondary motorneurons (SMN) expressing GFP. Cells absent for nls-mCherry are denoted (arrowheads). Scale bar = 10 µm. (C) Quantification for the percentage of sensory (RB), total ISL+ MNs, primary motorneurons (PMN), and secondary motorneurons (SMN) retaining nls-mCherry+ nuclei (red). (D) Cross section of a 30 hpf gfap:nls-mCherry embryo immunolabeled with anti-GABA to identify DoLA (D), CoSA (C), VeLD (V), and KA (K) interneurons. Subset Z-stacks and maximum intensity projections were generated for each neuronal population for clarity. Scale bar = 10 µm. (E) Quantification of the percentage of each interneuron population expressing nls-mCherry+ nuclei (red) at 30 hpf. (F, G) Cross sections of 24 and 72 hpf double transgenic gfap:nls-mcherry;olig2:eGFP embryos showing ventral Olig2+ populations as well as dorsal OPCs (asterisks). Scale bar = 10 µm. (H) Quantification of the percentage of ventral Olig2+ cells along with dorsal migrating OPCs that retain nls-mCherry+ nuclei (red) throughout oligodendroglial development. In all graphs, nls-mCherry negative cells are depicted in gray, and the numbers below each population represent the total number of cells assayed. |
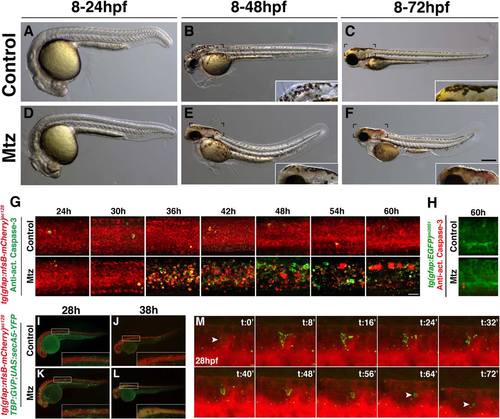
Metronidazole (Mtz) treatment induces radial glial cell death during late neurogenesis. (A-F) Gross morphology of transgenic gfap:nfsb-mCherrysc059 embryos following treatment. Enlargements comparing brain hemorrhaging compared with control in insets. Scale bar = 100 µm. (G, H) Lateral views of cell death within the spinal cord visualized by immunolabeling with antiactivated caspase-3. Scale bar = 20 µm. (I-M) Images of live gfap:nfsb-mCherrysc129 embryos at 28 and 38 hpf expressing secreted Annexin-V YFP labeling. (M) Example of NTR-mCherry+ cell with radial glial morphology expressing Annexin-V (YFP) labeling undergoing apoptosis over the course of 72 min. |

Spinal cord radial glial debris is cleared by microglia. (A-B3) Lateral views of 72 hpf double transgenic gfap:nfsb-mCherrysc059;pU1:egfp embryos to depict macrophages (arrows) and microglia (arrowheads). (C-D3) Lateral views of 72 hpf double transgenic gfap:nfsb-mCherrysc059;mpeg:eGFP embryo showing the presence of macrophages. (E-F3) Lateral views of a 72 hpf gfap:nfsb-mCherrysc059;pU1:eGFP embryo injected with control or spi1b morpholino (spi1b MO). (G) Quantification depicting percent of the total spinal cord with immune cells present in control (untreated) and Mtz (treated) embryos expressing either the mpeg or pU1 promoter and injected with spi1b MO. (H) Quantification of the levels of NTR-mCherry+ expression through average pixel intensity in control embryos and embryos treated in Mtz that were either uninjected or injected with spi1b MO. Scale bar = 20µm. |

Radial glial ablation reduces the neural progenitor population. (A-F) Cross sections of 24, 48, and 72 hpf double transgenic gfap:nfsb-mCherrysc059;-3.9nestin:GFP embryos treated with (A-C) vehicle control or (D-F) Mtz. All sections were immunolabeled with anti-GFP to enhance the signal of the 3.9nestin:gfp transgene. (G-L) Cross section views of 24, 48, and 72 hpf gfap:nfsb-mCherrysc059 embryos immunolabeled with anti-Sox2 (green) to visualize neural stem cell populations following treatment with (G-I) vehicle control or (J-L) Mtz. Ventral populations not lost following ablation are denoted (arrowheads). (M-P) Two examples of transverse sections of the spinal cord of 96 hpf gfap:nfsB-mCherry control (M, N) and Mtz-treated (O, P) embryos labeled for Blbp (green), Gfap (white), and nuclei (Hoechst). (M′-P′) mCherry and Blbp channels for the corresponding sections seen in M-P. A single Blbp+ midline cells can be seen with minute mCherry expression in a small lateral membrane process (M′ arrowhead); however, more laterally positioned Blbp cells were consistently negative for mCherry (M′, N′) as was the vast majority of Blbp labeling following gfap-mediated ablation (O′,P′). Scale bar = 10µm. |

Radial glial ablation and its effect on cell proliferation. (A-H′) Cross section views of proliferative cells within spinal cords of (A-D′) vehicle control and (E-H′) Mtz-treated embryos throughout neurogenesis visualized by immunolabeling with anti-BrdU (green), anti-Gfap (white), and Hoechst nuclear dye (blue). (A′-H′) represent the same images in (A-H) but only showing anti-Gfap and anti-BrdU labeling. BrdU+ nuclei outside of the spinal cord (white asterisks) or straddling the border (yellow arrowheads) are denoted. Scale bar = 10 µm. (I) Quantification of all BrdU+ populations visualized within the spinal cords between control (black line) and Mtz (green line) treatment groups. (J) Quantification of all elongated BrdU+ populations found outside of the spinal cord between vehicle control (gray) and Mtz (green) treatment groups. (K, L) Cross section views of (K) control and (L) Mtz-treated embryos immunolabeled for BrdU (cyan) and Sox2 (green) at 96 hpf. Scale bar = 10 µm. (K′-L3) Enlarged view of ventral Sox2+/NTR-mCherry negative cells (outlined) to denote cycling cells within this population (yellow asterisk). Scale bar = 5 µm. (M, N) Quantification of the two cycling Sox2+ populations present in the spinal cord following ablation. In all graphs, control averages are depicted in gray and Mtz averages are in black. Significant increases are depicted as black asterisks, and significant decreases are depicted as red asterisks. |

Reductions in later-born neurons and glia following radial glial ablation. (A, B) Lateral views of spinal cords showing interneurons immunolabeled with anti-GABA within control and Mtz-treated gfap:nfsb-mCherrysc129 embryos and quantified in (C). CoSA interneurons are highlighted in green. (D, E) Lateral views of secondary motorneurons within control and Mtz-treated gfap:nfsb-mCherrysc059;gata2:eGFP embryos and quantified in (F). (G, H) Lateral views of oligodendrocyte progenitor cells (OPCs, yellow asterisks) in control and Mtz-treated gfap:nfsb-mCherrysc059;olig2:eGFP embryos and quantified in (I). Black asterisks denoted significance. Scale bar = 50 µm. |

Temporal increase in transgene expression within the gfap:nlsmCherry line. Brightfield and fluorescent images of gfap:nls-mCherry embryos. Scale bar = 100µm. (D-F) Coexpression of gfap:nls-mCherry and gfap:eGFPmi2001 lines. Scale bar = 10µm. |

Brain lipid binding protein expression in the zebrafish spinal cord.(A-F) Transverse sections of the spinal cord of wild type embryos from 24hpf to 96hpf labeled for anti-Blbp (green), anti-Gfap (white), and nuclei (Hoechst, blue). (A′-F′) Single channel of Blbp labeling for the corresponding sections seen above. |

gfap:nfsb-mCherry transgenic lines. (A) Construct design using 7.4kb of the zebrafish gfap regulatory elements driving expression of the E. colinfsB gene fused to the mCherry reporter. (B-I) Stable transgene expression in the gfap:nfsb-mCherrysc059 (B-E) and gfap:nfsb-mCherrysc129 (F-I) Alleles over time. (J-L) Transgene expression of the two gfap:nfsbmCherry alleles within the spinal cord as compared to gfap:gfpmi2001 line, which shares the same regulatory elements. Scale bar = 100µm. |

Metronidazole (Mtz) treatment induces dynamic changes in mCherry expression.(A-F) Fluorescent images of live gfap:nfs-mCherrysc059 embryos following treatment with vehicle control (A-C) or Mtz (D-F). Higher magnification views of mCherry expression in the anterior (Somite 11) and posterior (somite 26) spinal cord. Scale bar in F = 100µm, scale bar in insets = 20µm. |
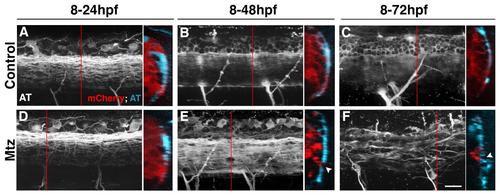
Loss of radial glia disrupts spinal cord axon organization (A-F) Lateral views of spinal cord axons within control and Mtz treated gfap:nfsbmcherry sc059 embryos immunolabeled with anti-acetylated tubulin (AT, white). Alongside each image is an excerpt from the Z stack rotated along the X-axis to show correlations between NTRmCherry (red) and AT labeling (blue). Red line depicts the location along the Z-axis where the rotated optical section is found. (A-C) Uniform, uninterrupted axon tracts are found throughout the spinal cords of control treated embryos at all time points assayed. (D) At 24hpf, no observable difference is seen (A). (E) At the onset of ablation, defects in axon organization can be observed in the spinal cord. When rotated, these defects (arrowheads) align with regions with reduced NTR-mCherry labeling or NTR-mCherry+ debris, which becomes more severe over time (F). No radial glial or axonal defects were observed in Mtz-treated gfap:eGFPmi2001 embryos at any ages assayed throughout this study (data not shown), demonstrating that any observed phenotypes correspond to the direct loss of radial glia. Scale bar = 20µm. |
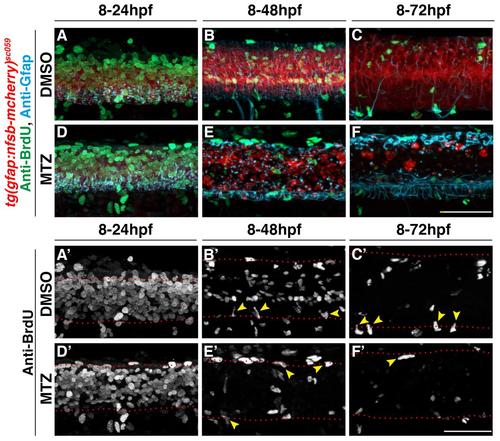
Changes in BrdU+ nuclei present within and surrounding the neural tube following astroglialablation.(A-F) Lateral MIPs of gfap:nfsbmCherrysc059 immunolabeled with anti-BrdU (green) and anti-Gfap (cyan) during neurogenesis following treatment with vehicle control (A-C) or Mtz (D-F). (A′-F′) Single channel images of (A-F) depicting only anti-BrdU. Spinal cord boundary is outlined in red. Nuclei that appear to span the spinal cord boundary are denoted (arrowheads). Scale bar = 50µm. |
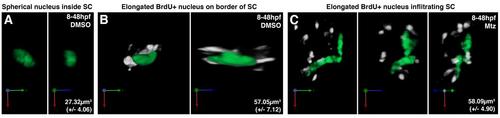
3-D analysis of BrdU+ nuclei surrounding and within the neural tube following astroglial ablation.(A-C) Representative projections of nuclei found within (A) and outside (B-C) of the spinal cord. Outer nuclei are depicted with anti-Gfap labeling (white) to denote their relationship with the spinal cord border. Average volumes for each population are represented in each example. |