
- Title
-
Mechanosensory organ regeneration in zebrafish depends on a population of multipotent progenitor cells kept latent by Schwann cells
- Authors
- Sánchez, M., Ceci, M.L., Gutiérrez, D., Anguita-Salinas, C., Allende, M.L.
- Source
- Full text @ BMC Biol.
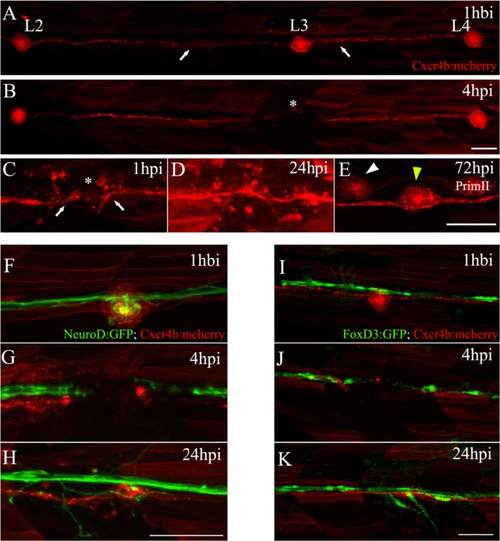
Electroablation as a method for localized tissue injury in the posterior lateral line (PLL) of zebrafish larvae. a Trunk of a tg(cxcr4b:mCherry) larva showing red-labeled PLL cells, including the second, third, and fourth neuromasts of the PLL (L2, L3, and L4) connected by interneuromastic cells (INCs, white arrows). The image was captured 1 hour before injury (hbi). b The trunk of the same larva 4 hours post injury (hpi). The asterisk shows the damaged zone, where the L3 neuromast was located. c–e Higher magnifications of the injured area showing the process of neuromast regeneration. c At 1 hpi, we observed the gap generated between INCs (white arrows) flanking the injury zone (asterisk). d At 24 hpi, INCs located on both sides of the gap reconnected. e At 72 hpi, the L3 neuromast had regenerated (yellow arrowhead). At this stage, the secondary primordium (PrimII) deposited a secondary neuromast (white arrowhead). f–h Double transgenic tg(neurod:GFP; cxcr4b:mCherry) larvae, where the afferent lateral line neurons are labeled in green and neuromasts are labeled in red. f This image shows the L3 region 1 hbi. g Electroablation of L3 interrupts the lateral line nerve. h The nerve regenerates after 24 hpi. i–k Double transgenic tg(foxd3:GFP; cxcr4b:mCherry) larvae, showing the Schwann cells labeled in green (associated with the nerve) and neuromasts and INCs labeled in red. As occurs with the INCs, Schwann cells reconnected after 24 hpi (k). Scale bar: 50 μm EXPRESSION / LABELING:
|
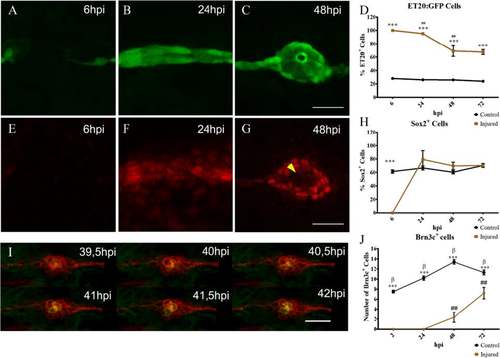
Neuromast regeneration depends on interneuromastic cell accumulation. The L3 neuromasts of 3 days post fertilization tg(et20:GFP) larvae were electroablated or left uninjured as controls, and fixed at different time points after damage (hours post injury, hpi). a–c Detection of ET20:GFP-labeled cells after electroablation. d Quantification of GFP-labeled cells at the L3 position (n = 10). Initially, in electroablated fish, all accumulating cells expressed GFP but the percentage of GFP versus total cells diminished significantly between 24 and 48 hpi (## p < 0.01). At all stages after injury, L3 neuromasts of electroablated larvae had a much higher proportion of ET20:GFP cells in comparison with control larvae (***p < 0.001). e–h Immunodetection and quantification of Sox2-expressing cells (n = 10). At 6 hpi, few, if any, Sox2-expressing cells were seen in the injury zone but, after 24 hpi, the number of Sox2-expressing cells was approximately the same as in controls (h) (***p < 0.001) . Note the loss of Sox2 expression in the most centrally located cells at 48 hpi (g, yellow arrowhead). i Images extracted from a time-lapse sequence of a double tg(cxcr4b:mCherry;brn3c:GFP) electroablated larva. The sequence reveals the progressive appearance of GFP expression in centrally located hair cells. j In vivo quantification of the number of hair cells in control and injured larvae that regenerated their neuromasts at 2, 24, 48, and 72 hpi (n = 15); ## and β indicate statistical differences within the same group, control or injured, comparing neighboring values (β p < 0.001, ## p < 0.01), while asterisks reflect statistical difference between control and injured at the same time points (***p < 0.001). Note that the ET20:GFP and Sox2 expression data corresponding to 6 and 24 hpi (shown in d and h, respectively), come from a mix of larvae committed and not committed to regenerate. This is because the samples had to be fixed at stages in which we could not distinguish between the outcomes. Scale bar a–g, i: 50 μm. Further details on replicates are provided in “Quantifications and statistical analysis” in the “Methods” section |
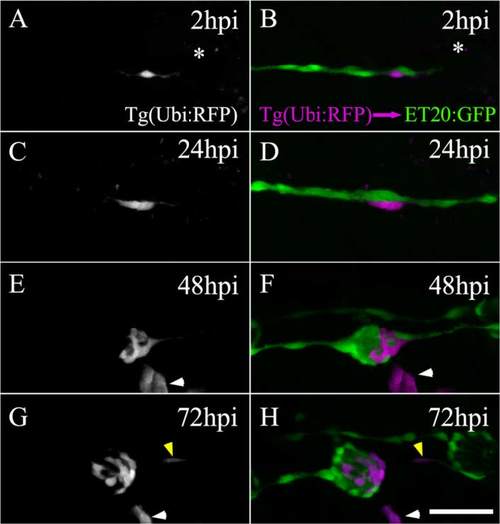
Regenerated neuromasts are chimeric structures derived from two interneuromastic cells (INCs). Transplanting cells from a tg(ubiquitin:RFP) blastula to a tg(et20:GFP) blastula occasionally resulted in fish with one or a few labeled INCs. A transplanted larva harboring a single labeled INC near L3 was selected 3 days post fertilization and subjected to electroablation of the L3 neuromast (a, b). The asterisc indicates the position of the ablated neuromast. The left panels (a, c, e, g; only the red fluorescent protein [RFP] channel is shown) show the behavior of the transplanted cell through time. The right panels (b, d, f, h) show ET20+ cells of host larvae (green) and the transplanted cells (pseudocolored in magenta). During regeneration, the single transplanted cell divided and its progeny differentiated into different cells types of the mature neuromast. At 72 hpi, a red-labeled cell (here in magenta) can be observed among the INCs, suggesting that at least one daughter cell maintained the original identity of the progenitor (g, h, yellow arrowhead). Note that the transplantation experiment randomly generated labeled cells of diverse lineages that did not participate in neuromast regeneration (see for example, e–h, white arrowhead). Scale bar: 50 μm |
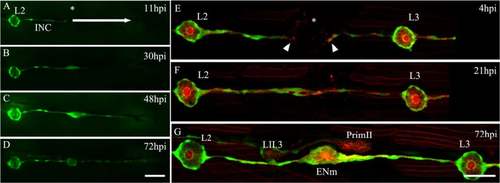
Contribution of interneuromastic cells (INCs) to neuromast regeneration. a–d Complete elimination of all neuromasts and INCs between L3 and L8 was done 3 days post fertilization in tg(et20:GFP) larvae by electroablation (n = 20). Neuromasts were electroablated whereas INCs were ablated by mechanical displacement of the microelectrode through the skin. The white arrow in a shows the direction of the movement of the microelectrode. The asterisk in a shows the position of the L3 neuromast before electroablation. After injury, the behavior of INCs located proximal to the gap was examined at 11 hours post injury (hpi) (a), 30 hpi (b), 48 hpi (c), and 72 hpi (d). Starting at 30 hpi, INCs accumulated at the injury zone and organized to form a new neuromast. They also migrated, beginning at 48 hpi, extending caudally to create a new line of INCs. e–g An ectopic neuromast can appear de novo after electroablation. e The row of INCs between L2 and L3 was interrupted by electroablation at the position of the asterisk; the last remaining INCs are indicated by arrowheads. f At 21 hpi, INCs started to accumulate, reconnecting the line of cells. g At 72 hpi, a neuromast formed between L2 and L3 at a position where there was no preexisting neuromast (labeled ENm, ectopic new neuromast). At this stage, the secondary primordium (PrimII) was migrating close to L3 and had deposited secondary neuromast LII.3. Further details on replicates are provided in “Quantifications and statistical analysis” in the “Methods” section. Scale bar: 50 μm |
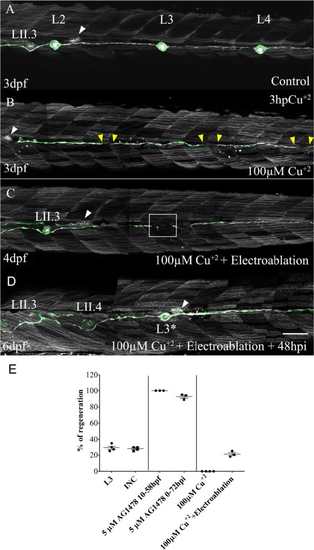
Damage to Schwann cells is required for neuromast regeneration. tg(cxcr4b:mCherry;et20:GFP) larvae 3 days post fertilization (dpf) were treated with 100 μM CuSO4 for 2 h to ablate all neuromasts without affecting Schwann cells. a A control (uninjured) larva showing the region between L2 and L4. The secondary primordium (PrimII) is seen migrating (white arrowhead in all images). b Three hours after copper treatment, all neuromasts of the lateral line system had been chemically ablated (gaps demarcated by yellow arrowheads). c At 24 hours post treatment (4 dpf), interneuromastic cells (INCs) had filled the gaps but no neuromast regeneration occurred. At this time, electroablation was carried out at the approximate position where L3 was (white box). d A new L3 neuromast formed only where electroablation took place at 48 hours post injury (hpi; at 6 dpf). Neither intervention (copper treatment or electroablation) impaired the migration of PrimII (white arrowhead) and deposition of secondary neuromasts (LII.3). The asterisk indicates the site of injury. e The graph shows the percentage of injured larvae that regenerated a neuromast after the different treatments: L3 neuromast electroablation (L3; n = 100); electroablation of INCs between the L2 and L3 neuromasts (INC; n = 100); L3 neuromast electroablation in larvae treated with 5 μM of AG1478 from 10 hpf until 58 hpf (5 μM AG1478 10–58 hpf; n = 75); L3 electroablation in larvae treated with 5 μM of AG1478 from 0 hpi until 72 hpi (5 μM AG1478 0–72 hpi; n = 75); 100 μM copper treatment (100 μM CuSO4, n = 100); or copper treatment combined with electroablation of L3 (100 μM CuSO4 + Electroablation; n = 60). Scale bar a–d: 100 μm. Further details on replicates are provided in “Quantifications and statistical analysis” in the “Methods” section |
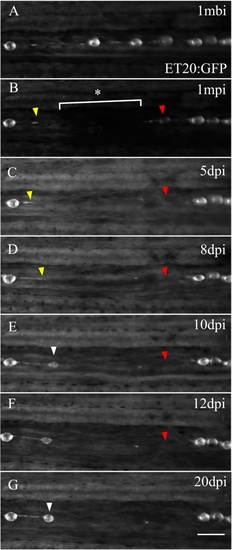
Adult caudal lateral line regeneration after electroablation. A 6-month-old tg(et20:GFP) fish was electroablated in the caudal fin lateral line by applying two pulses of 2 s duration and 25 μA current intensity (n = 60, three independent experiments). Images of the injury were taken beginning from 1-minute post injury (1 mpi) to 20 days post injury (dpi). The image in a was taken at 1 mbi to show the original position of the neuromasts. The asterisk and bracket in b show the extent of the damage. c, d The yellow arrowhead points to the rostral most interneuromastic cells located immediately proximal to the damage. The red arrowheads in each panel show the disappearance of the nearest neuromast located caudal to the injury. At 10 dpi, ET20+ cells accumulated (e, white arrowhead) and at 20 dpi had matured into a neuromast (g, white arrowhead). The position where regenerated neuromasts appeared did not recapitulate the original distribution of neuromasts before injury. Scale bar a–g: 100 μm |
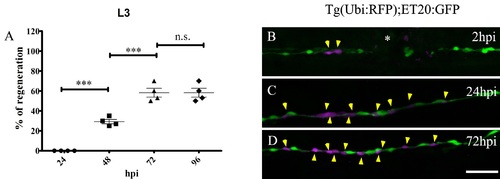
The non-regenerative outcome of neuromast electroablation results in restoration of a line of INCs at the site of injury. The L3 neuromast of transgenic tg(cxcr4b:mCherry; brn3c:Gap43-GFP) larvae was electroablated and the outcome was scored as regeneration if at least two Bn3c+ cells (hair cells) appeared in the injury zone after the indicated time (n = 100). (A) Quantification of the result; the data are expressed as the percentage of larvae that regenerated the L3 neuromast at different time points after injury. The first regenerated neuromasts can be detected starting from 48 hpi in 29.2 ± 2.2 % of cases. This percentage increases significantly and reaches 58.2 ± 4.4 % after 72 hpi. From 72 to 96 hpi, the percentage of larvae that regenerate neuromasts remains unchanged. (B–D) A 3 dpf tg(et20:GFP) fish was transplanted at the blastula stage with cells from a tg(ubiquitin:RFP) donor fish (transplanted cells pseudocolored in magenta) and its L3 neuromast was electroablated (asterisk in B). In 40 % of cases, the INCs migrate to the injury site, proliferate, but fail to accumulate and organize into a mature neuromast. Yellow arrowheads show the location of the different transplanted cells through time. Scale bar B–D: 50 μm. Further details on replicates are provided in “Quantifications and statistical analysis.” |
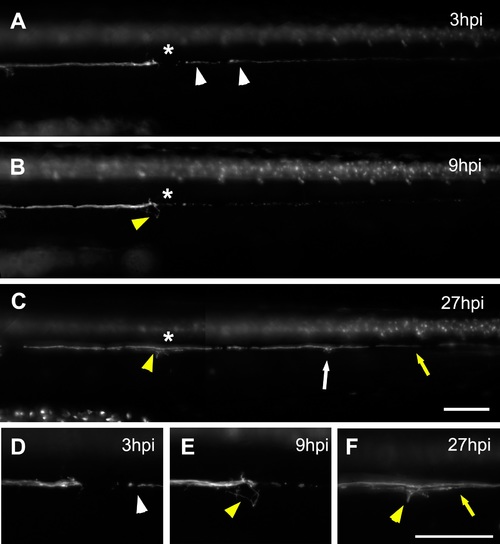
Behavior of the lateral line nerve after neuromast electroablation. g(neurod:GFP; cxcr4b:mCherry) larvae that express mCherry in all cells types of the lateral line and GFP in the lateral line nerve were electroablated at 3 dpf in the L3 neuromast (asterisk); images show only the GFP channel. (A) At 3 hpi, degenerating fragments of denervated axons are still present at the myoseptum (white arrowheads). (B) At 9 hpi, nerve fragments have been cleared and axons sprouting from the nerve stump begin to extend and explore the injured region (yellow arrowhead). (C) From 9 to 27 hpi, the nerve regrows caudally (yellow arrow). The asterisks indicates the injury site and the yellow arrowhead shows axons innervating this region. Also, the regrowing axons innervate more caudal neuromasts (white arrow). (D–F) Higher magnification of the injury zone at 3 hpi (D), 9 hpi (E), and 27 hpi (F). Scale bar: 100 μm. |
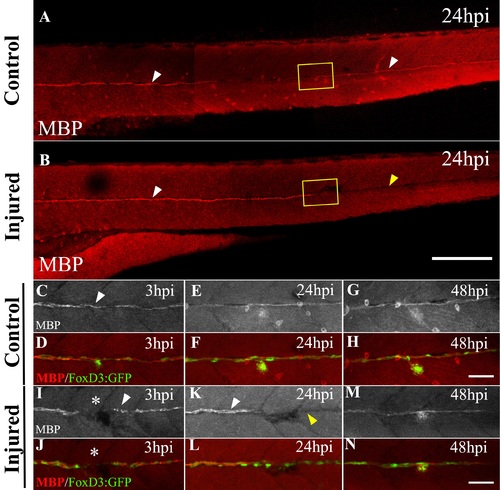
Temporary loss of MBP expression in caudally located SCs after L3 electroablation. tg(foxd3:GFP; brn3c:GFP) larvae 3 dpf were injured at the L3 neuromast and fixed at different time points. Expression of Brn3c:GFP was used as an indicator to locate the L3 neuromast. Fixed control and injured larvae were processed by immunohistochemistry to analyze MBP and GFP expression. (A, B) White arrowheads show MBP signal in 4 dpf control larvae and 24 hpi in injured larvae (only rostral to L3). The yellow arrowhead in B shows the loss of MBP expression in the caudal zone with respect to the injury site. (C–N) Double transgenic larvae tg(foxd3:GFP; brn3c:GFP) were processed in order to describe, by immunodetection, the time course of MBP expression in the vicinity of L3 in control larvae (C–H) vs injured larvae (I–N). MBP expression by itself is shown in monocolor (C, E, G, I, K, M), while MBP expression (red) merged with the FoxD3 expression (green) is shown in color (D, F, H, J, L, N). In control larvae, there is continuous expression of MBP from 3 to 5 dpf. The arrowhead in C shows the localization of the L3 neuromast. In injured larvae, the expression of MBP is fragmented after 3 hpi (white arrowhead in I), disappears after 24 hpi caudal to L3 (yellow arrowhead in K), and reappears after 48 hpi (M). Note that, despite the transient loss of the differentiation marker, SCs revealed by the presence of GFP are present throughout the regeneration process (J, L, and N). The asterisk in I and J indicates the site where injury was made. Scale bar A, B: 200 μm, C–N: 50 μm. |

INCs do not express Sox2 protein. tg(et20:GFP) transgenic larvae at 4, 5, and 6 dpf were fixed and immunolabeled with the anti-Sox2 antibody, revealed with red fluorescence. The top row (A, D, G) shows both GFP signal and Sox2 immunostain; middle row (B, E, H), Sox 2 expression; and bottom row (C, F, I), GFP label. Transgene-driven GFP expression is seen in INCs and in mantle cells of neuromasts. Sox2 expression is only detected in neuromasts, in progenitor cells that underlie hair cells, and in mantle cells (see [33]). At these stages, both primary (L1, L2, etc.) and secondary (LII.1, LII.2, etc.) neuromasts are present and the advancing PrimII (also expressing Sox2) can be seen. (TIF 5802 kb) |
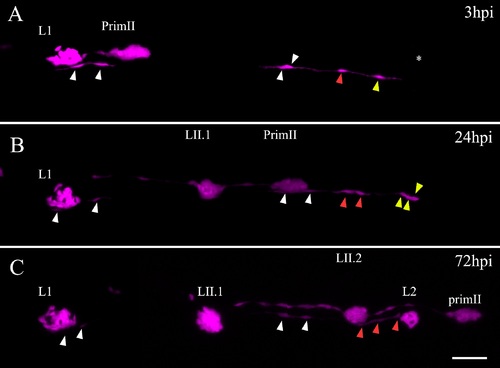
INCs respond to damage and behave like multipotent progenitor cells. Blastula cells from Tg(ubiquitin:RFP) embryos transplanted into tg(et20:GFP) embryos result in chimeric larvae with a few labeled INCs (magenta, labeled with arrowheads) that can be followed through time in vivo. (A) At 3 dpf, a chimeric larva was electroablated in the L2 neuromast; the asterisk shows the injury site. A proximal (yellow arrowhead) and more distal (red and white arrowheads) labeled INCs can be observed. (B) After 24 hpi, the INC proximal to the injury zone has proliferated and daughter cells begin to accumulate (yellow arrowheads) whereas the nearest neighboring INC seen in A divides once but the daughter cells do not move from their position (red arrowheads). The farthest labeled INCs (white arrowheads) do not divide. (C) After 72 hpi, a regenerated L2 neuromast appears in the position where the injury was made. With the exception of two cells, the entire regenerated L2 neuromast is derived from the single labeled INC cell (yellow arrowhead in A). The distal INC has divided once more but does not contribute to the regenerated neuromast (red arrowheads). From 24 hpi to 72 hpi (which corresponds to 4–6 dpf), the PrimII travels through this region and deposits the secondary neuromasts LII.1 and LII.2. Scale bar: 50 μm. (TIF 1069 kb) |
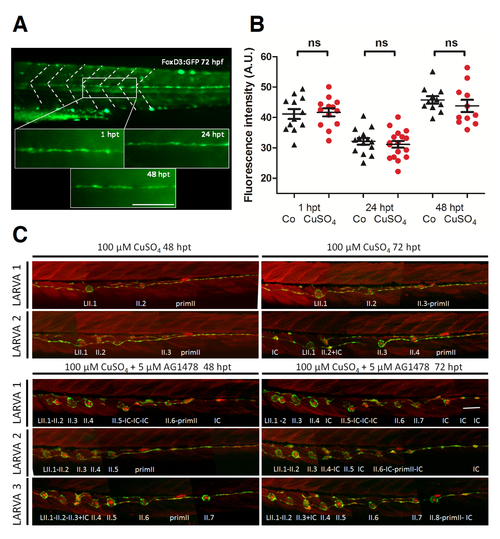
Copper sulfate treatment does not affect SCs or INCs. (A, B) 72 hpf tg(foxd3:GFP) transgenic larvae (SCs labeled with GFP) were treated for 2 h with 100 μM CuSO4 and imaged 1, 24, and 48 hpt; sibling control fish were left untreated. (A) An arbitrary area of the trunk above the anus was defined (encompassing the width of about three somites) and the “Measure Tool” of ImageJ was used to assign arbitrary units for mean green fluorescence intensity. (B) The graph shows data for control (Co) and copper-treated (CuSO4) fish at the three selected times. While mean values are significantly different between the developmental stages, control fish vs CuSO4-treated fish (control 1, 24, 48 h n =12, 14, 11 respectively and 1, 24, 48 hpt n =13, 17, 11 respectively) at equivalent ages were not significantly different (ns) (P < 0.05). (C) Double transgenic tg(cxcr4:mCherry; et20:GFP) larvae at 3 dpf were treated for 2 h with 100 μM CuSO4 and imaged 48 and 72 hpt. Two larvae are shown at both time points. Note that only secondary lateral line neuromasts (LII) are seen because the copper treatment at day 3 permanently ablates all primary neuromasts. In the bottom three rows, sibling fish were treated in the same way but, after the copper solution was washed out, 5 μM AG1478 was added to the medium and the fish were imaged 48 or 72 hours later; three larvae are shown at both time points. Note that supernumerary neuromasts appear in these animals (compare with two larvae in top half), indicating that INCs are not affected by copper treatment and retain their progenitor potential. (PDF 1994 kb) |