
- Title
-
Multicolor Cell Barcoding Technology for Long-Term Surveillance of Epithelial Regeneration in Zebrafish
- Authors
- Chen, C.H., Puliafito, A., Cox, B.D., Primo, L., Fang, Y., Di Talia, S., Poss, K.D.
- Source
- Full text @ Dev. Cell

Multicolor Labeling of Superficial Epithelial Cells in skinbow Zebrafish (A) Schematic drawing of human and zebrafish skin. Zebrafish skin is a simple stratified epithelium without keratinized layers, with a surface covered by transparent mucus. EC, epithelial cell. (B) Brightfield view of an adult skinbow animal. Green boxes indicate areas where the z stacked confocal images shown in (C) (D) were captured. Scale bars, 2 mm. (C) Multicolor labeling of skin epithelium in adult skinbow animals from areas shown in (B). Scale bars, 100 μm. (D and E) Multicolor labeling of corneal and scale epithelium in skinbow. A dissected scale is shown in (E). SECs cover the exposed portion of the scale (top). Scale bars, 100 μm. |

Analysis of Epithelial Cell Turnover by Multicolor Labeling and Live Imaging (A) Brightfield view of adult zebrafish caudal fin. Inset depicts the alternating pattern of bony ray (black arrows) and interray tissues. Red box indicates areas where the z stacked confocal images were captured. Scale bars, 1 mm. (B) Multicolor labeling of adult fin epithelium. Superficial epithelial cells (SECs) on the fin surface label with one of ∼70 unique colors (see Experimental Procedures for details). Scale bars, 50 μm. (C) Examples of SEC color dynamics during their presence on the fin surface. 33 representative cells are shown here, illustrating color stability over several days. (D) Quantitative analysis showing color stability over time. The distance between the median color of each trajectory and its value at all times was calculated and aligned to their first appearance. Color distance is relatively high at early time points because of weak intensity upon first appearance but stabilizes after the first 48 hr. The green line represents the mean of trajectories (n = 87). (E) Quantitative analysis indicating changes in SEC size over time. Single-cell trajectories were aligned with respect to their first appearance on fin surface for comparison. Each line represents an independent trajectory with a black cross at the end indicating cell loss (n = 186 from four animals). The green line represents the mean of trajectories (n = 186). (F) Quantitative analysis showing average SEC lifespan under homeostatic conditions (n = 87, 32, 37, and 30 from four animals). Distribution of cell lifespan was measured as the duration of complete trajectories (from first appearance to loss). Bars indicate mean ± SD to indicate the spread of subjects. (G) Large-scale surveillance of SEC loss over time. Percentage of cell loss events was plotted as the sum of the missing cell number divided by the total cell number at day 0 (n = 1077, 992, 854, and 719 from four animals), which could rise above 100% over an extended time period. |

Regeneration of Surface Injuries Involves a Biphasic Mechanism of Hypertrophy and Accelerated Replacement (A) (Top left) Schematic of exfoliation injury. (Images) A time-lapse imaging series showing surface injuries and regeneration over a 4-day period. Scale bar, 50 μm. (B) Enlarged view of a few cells during surface regeneration. Red dashed lines outline boundaries of a yellow cell undergoing transient hypertrophy. Scale bar, 50 μm. (C) Quantification of relative change in SEC size after injury. The sizes of individual cells were normalized to their size immediately after injury, to indicate relative change (30% ± 5.4% greater at 2 hpe; 65.7% ± 5.9% greater at 12 hpe). Individual trajectories of spared SECs within the injured region were extracted from three independent scratch injuries (n = 20, 24, and 11). Bars indicate mean ± SD. Statistical significance was assessed by a Mann-Whitney test (2 hpe versus 12 hpe, ∗p < 10−4). (D) Quantification of SEC velocities after injury. PIV type techniques were used to track single points in the images and compare typical velocities across adjacent time frames. Uninjured SECs and those at 96 hr post scratch (hps) show similar velocities, while SECs are more motile immediately after injury. Values below the plot are the number of points (blue) used to build the plot. Bars indicate mean ± SD. Statistical significance was assessed by a Mann-Whitney test (uninjured versus 2 hpe, 12 hpe, or 24 hpe, ∗p < 10−5 for all cases). (E) Quantification of change in surface coverage during regeneration (n = 3). (F) Quantification of change in total SEC number during regeneration (n = 3). |

Ray and Interray Epithelial Sheets Respond Distinctly to Amputation Injury (A) (Left) Schematic of fin amputation. (Right) Confocal image indicating extruded SECs at the amputation plane by 60 mpa. A three-dimensional image was reconstructed from z stacks of confocal images, using Imaris to facilitate counting of extruded cells. White arrows point to extruded cells along the amputation plane. Scale bar, 50 μm. (B) Quantification of extruded SECs at the injury site at 60 mpa (n = 14 regions from seven animals). (C) Time-lapse images of optical sections at the same z position post amputation. Images were captured every 10 min starting at 10 mpa. White dashed lines outline fin rays. Red arrow indicates that the fin ray stump is covered first by basal and suprabasal cells, closed trailed by SECs. Scale bar, 50 μm. (D) Confocal images captured at 10 and 40 mpa. White dashed lines outline regions covering fin rays. Images were recorded every 2 min for 30 min starting at 10 mpa. White, pink, and blue arrows point to individual cells at 10 and 40 mpa. Scale bar, 50 μm. The red arrow indicates the plane of amputation. (E) Position of single cells perpendicular to the amputation plane with respect to starting position. Average trajectories are plotted in green lines with blue (interray SECs) and red (ray SECs) filled circles. (F) Velocities were obtained by single-cell tracking as finite differences. (G) A confocal image captured at 40 mpa from animals treated with gadolinium (Gd3+). White dashed lines outline regions covering fin rays. (H) Relative velocity of interray with respect to ray SECs in vehicle-treated (cyan, n = 7) versus Gd3+-treated animals (magenta, n = 5) averaged over all trajectories first and then over different samples. Data are plotted as mean ± SEM. Gd3+ treatment increases differential migration rates of interray SECs with respect to ray SECs. In addition, migration persists in Gd3+-treated animals beyond 40 min. (I) Quantification of relative changes in cell shape for interray SECs (blue) and ray SECs (red) in either vehicle- or Gd3+-treated animals. Cell shape was determined by aspect ratio, which was obtained as the major to minor axis ratio for each cell. The aspect ratio of individual cells at 40 mpa was normalized to the average value at 10 mpa to show relative change. Total numbers of analyzed trajectories are indicated below each point cloud, combined from seven (vehicle) and five (Gd3+) animals. Mann-Whitney test of vehicle versus Gd3+interray SECs (blue circles) yielded a significant difference in the medians (green dots) of the two samples (p = 0.0038). |

Acquisition of Surface Epithelium from Pre-existing and De Novo Pools during Fin Regeneration (A) Time-lapse images of an amputated skinbow fin during regeneration. Images were captured once each 12 hr over a 4-day period. White dashed line marks the growth front. White solid line indicates the amputation plane. Blue, yellow, and white arrows point to individual cells across consecutive imaging times. Scale bars, 50 μm. (B) Reconstruction of trajectories from one representative animal. Each line here represents a reconstructed trajectory of a migratory cell. Color codes for time (i.e., dark blue is the beginning of each trajectory, 12 hpa, and cyan is the end, 96 hpa). To better visualize the movement of cells within the epidermis, a red rectangle indicates positions in the initial and final frames. The rectangle is translocated and deformed, revealing both cell migration and deformation of the tissue. Rightward movement of the cells likely reflects the stereotypical growth pattern of the lateral portion of the dorsal lobe, from which images were captured. (C) Quantification of velocities of individual cells (red dots; n = 85). The velocity of the moving growth front is marked with a black cross. (D) Quantitative analysis of average SEC distances traveled between 12 and 96 hpa. 100 reconstructed trajectories each from five animals were considered. Bars indicate mean ± SD. (E) Quantitative analysis representing SEC contribution from de novo creation versus that generated by migration of SECs identified at 12 hpa. We tracked the region, initially located proximal to the amputation plane at 12 hpa, by reconstructing cell movements at large-scale (Figure S6B). The extent of unlabeled regions of SECs already present at 12 hpa (pre-existing fraction) and of SECs that appear over the course of the experiment (de novo fraction) is quantified at each time. The contribution of newly added SECs was calculated as the difference between the labeled and pre-existing fractions. (F) Brightfield view of a fin at 10 dpa. Scale bars, 0.5 mm. Blue and red boxes indicate areas where z stacked confocal images in (G) were captured. White dashed line indicates the amputation plane. Scale bar, 50 μm. (G) Images of skinbow SECs from distal (#1) and proximal (#2) regions of the same fin for each individual at 10, 14, and 30 dpa. At 10 dpa, distal SECs are visibly larger than proximal SECs. Scale bars, 50 μm. (H) Quantification of cell size for proximal (red) and distal SECs (blue) in regenerating fins (n = 5 animals for each time). Total numbers of analyzed cells are indicated below each point cloud. Bars indicate mean ± SD. Statistical significance between proximal and distal SEC cell sizes in 10 dpa and 14 dpa samples was assessed by a one-tailed t test, p < 10−5. Cell sizes indicate sampled population averages of cells at all stages of surface life from fins that would not display any effects of repetitive imaging. (I) Quantification of fold change in cell size for proximal (red) and distal SECs (blue) in regenerating fins. Total numbers of analyzed cells are indicated below each point cloud. Bars indicate mean ± SD. The cell size ratio (distal SECs/proximal SECs) steadily decreases from 1.65 ± 0.04 (10 dpa), to 1.34 ± 0.03 (14 dpa), to 1.09 ± 0.03 (30 dpa). Uninjured fins have a ratio of 1.14 ± 0.01. |

skinbow Labeling of the Outermost Layer of Adult Zebrafish Fin Epidermis, Related to Figure 1. (A) Single-transgene Brainbow-based construct. (B) Longitudinal sections of the caudal fin in skinbow and β- act2:EGFP lines. Although the Brainbow cassette is driven by the β-actin2 promoter in the skinbow construct, the expression is restricted to the SEC layer, likely a consequence of the transgene integration site. By contrast, EGFP fluorescence in the β-act2:EGFP line is present in all fin epithelial cell layers. (C) Longitudinal sections of skinbow fins assessed by in situ hybridization, visualizing CreER RNA expression in the SEC layers. (D) Longitudinal sections of distal tips of skinbow and wild-type caudal fins. Only the red channel is excited in these images. Scale bars, 50 μm. |
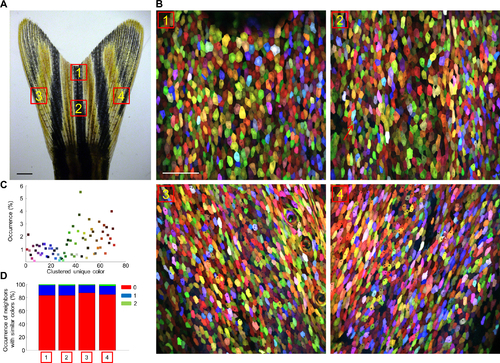
skinbow Labels the Entire Fin Surface with Diverse Colors, Related to Figure 2. (A, B) Brightfield view of adult zebrafish caudal fin. Scale bars, 1 mm. Red boxes in (A) indicate areas where z-stacked confocal images (B) were captured. Scale bars, 100 μm. Red arrows in Area-2 point to migratory immune cells, a minor labeled population. (C) Occurrence of each color cluster. Green, brown and red colors are slightly more frequent than blue and violet colors (see Experimental Procedures for details). Cells from all 4 areas shown in (B) were combined for analysis. (D) To evaluate the spatial randomness of the color, we quantified occurrence of cells from all 4 areas shown in (B) with nearest neighbors of the same color cluster. Red, blue, and green areas in the row stacked plot represent cases with 0, 1, or 2 same-color neighbors, respectively. |

Sequence of Collective SEC Behaviors During Fin Regeneration, Related to Figure 6. (A, B) Brightfield view of adult zebrafish caudal fin at 10 dpa. Scale bars, 0.5 mm. Red boxes in (A) indicate areas where z-stacked confocal images (B) were captured. Scale bars, 100 μm. White-dashed lines indicate the amputation plane. Images in (A) and (B) were captured from the same animal. Scale bars, 100 μm. (C) Wounds seal in the first hour post amputation (hpa) by interactions between alternating SEC sheets with distinct cell displacement and shape responses. Many SECs are extruded at the amputation plane during this process. At 24 hpa, spared SECs are recruiting to the regenerating area over long distances. By 36 hpa, do novo SECs are well-integrated with preexisting SECs, and new SEC creation becomes the predominant cellular supply of surface epithelium. At late stages in ongoing regeneration (10 dpa), fins retain many hypertrophic SECs at the distal regenerating tips. This phenotype becomes fully resolves after completion of appendage replacement (30 dpa), and SECs have a similar size distribution across the entire appendage. Pre-existing cells are labeled in blue; de novo SECs are labeled in yellow |
Reprinted from Developmental Cell, 36, Chen, C.H., Puliafito, A., Cox, B.D., Primo, L., Fang, Y., Di Talia, S., Poss, K.D., Multicolor Cell Barcoding Technology for Long-Term Surveillance of Epithelial Regeneration in Zebrafish, 668-80, Copyright (2016) with permission from Elsevier. Full text @ Dev. Cell