
- Title
-
Multicolor mapping of the cardiomyocyte proliferation dynamics that construct the atrium
- Authors
- Foglia, M.J., Cao, J., Tornini, V.A., Poss, K.D.
- Source
- Full text @ Development
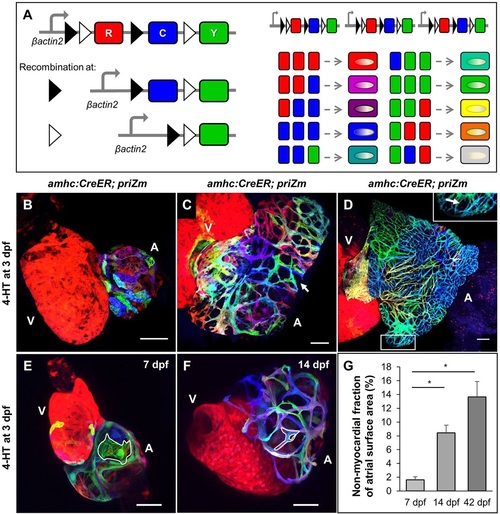
The larval zebrafish atrial wall undergoes permanent myocardial webbing. (A) Design of the priZm cassette and example spectrum of possible color combinations. (B-D) Surface myocardium of 7dpf, 14dpf and 42dpf amhc:CreER; priZm hearts, respectively, after recombination with 4-HT at 3dpf. V, ventricle; A, atrium. White arrows indicate gaps in myocardium. (E,F) 3D reconstructions of hearts from amhc:CreER; priZm animals treated with 4-HT at 3dpf and collected at 7dpf and 14dpf, respectively. Examples of individual cardiomyocytes in the atrium (A) are outlined in white. Individual cardiomyocytes in the ventricle (V) are not distinguishable. (G) Percentage of total atrial surface area not covered by myocardium at 7dpf, 14dpf and 42dpf (means±s.e.m.; n=7 hearts). Means are significantly heterogeneous (one-way ANOVA, P<0.001) and asterisks indicate means that are significantly different (Tukey-Kramer test, P<0.05). Scale bars: 50µm in B,C,E,F and 100µm in D. |

Atrial pectinate branches directly from wall cardiomyocytes. (A,B) 3D reconstructions of a 14dpf amhc:CreER; priZm heart at the surface (A) and with the anterior hemi-section obscured to show interior structures (B). The atrio-ventricular canal (AVC) and newly formed pectinate fibers (pec) are indicated. (C) Surface and (C′) deep optical sections of a 42dpf atrium. Arrowhead indicates monoclonal pectinate fiber contacting atrial wall. Arrow indicates thicker, polyclonal pectinate fiber deeper in the lumen. (D) Surface and (D2) deep optical sections of a 10dpf cmlc2:CreER; priZm ventricle treated with 4-HT at 3dpf. Arrows indicate a point of contact between a trabecular (trab) and ventricular wall cardiomyocyte (wall). Note that red cardiomyocytes, as the unrecombined color, are uninformative for clonal concordance assessment. (E) Cryosection of a 42dpf amhc:CreER; priZm atrium exhibiting monoclonal, clonally concordant pectinate (pec) muscle (E′) and a polyclonal fiber containing clonally concordant muscle (E′′); Atr, atrium. (F) Frequency with which pectinate and trabecular muscle share a clonal origin with adjacent cardiomyocytes of the atrial and ventricular wall, respectively [means±s.e.m.; n=5 (atria) and 11 (ventricles) from 16 hearts]. Asterisk indicates significantly different means (two-tailed Student′s t-test, P<0.001). Scale bars: 100µm in C,C′,E-E′′ and 50µm in D,D2. |

The atrial wall forms by heterogeneous expansion of clonally related muscle patches. (A-C) Surface myocardium of 7dpf, 14dpf and 42dpf amhc:CreER; priZm hearts, respectively, with examples of traced clones outlined in white. (D) Number of distinct clones within 7dpf, 14dpf and 42dpf amhc:CreER; priZm atria (means±s.e.m.; n=8 hearts each). The difference in the indicated means was not significant (ns) using one-way ANOVA (P>0.05). (E) Histograms of relative clone size distributions at 7dpf, 14dpf and 42dpf. Data are aggregated from n=8 hearts per time point. The data are log-transformed to better show both tails of the distributions. (F-H) Distributions of relative clone sizes in individual hearts, grouped by age (n=8 at each time point), with indicated clones in F outlined in white from a 14dpf (G) and a 42dpf (H) heart. Scale bars: 50µm in A,A′,B,B′,G and 100µm in C,C′,H. |
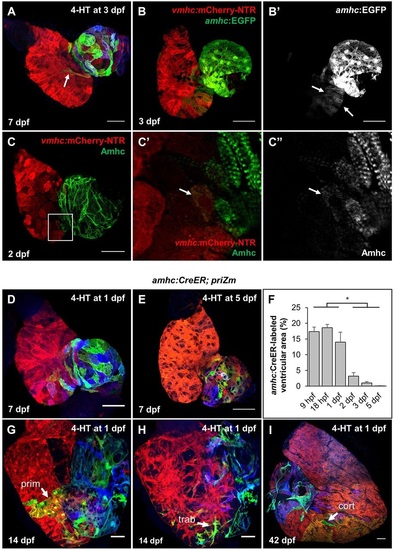
Transiently amhc+ cardiomyocytes populate the ventricular apex. (A) Surface myocardium of a 7dpf heart from an amhc:CreER; priZm animal treated with 4-HT at 3dpf, displaying a non-red cardiomyocyte (white arrow) on the ventricular side of the AV junction (dashed line). (B) Surface myocardium of a 3dpf heart from a vmhc:mCherry-NTR and amhc:EGFP animal. (C) Surface myocardium of a 2dpf heart expressing vmhc:mCherry-NTR and immunostained for Amhc. Magnified region shows area of EGFP expression within the ventricle (V) near the AV junction (dashed line). Arrow indicates an Amhc+ cardiomyocyte in the ventricle. (D,E) Surface myocardium of 7dpf amhc:CreER; priZm hearts from animals treated with 4-HT at 1dpf or 5dpf, respectively. (F) Percentage of ventricular surface area labeled in 7dpf amhc:CreER; priZm hearts treated at 9hpf (n=7), 18hpf (n=8), 1dpf (n=7), 2dpf (n=7), 3dpf (n=8) or 5dpf (n=7) (means±s.e.m.). Asterisk indicates that the means are significantly heterogeneous (one-way ANOVA, P<0.05) and a significant difference exists between the indicated groupings (Tukey-Kramer test, P<0.05). (G,H) Surface and deep myocardium, respectively, of a 14dpf amhc:CreER; priZm heart treated with 4-HT at 1dpf. Cardiomyocytes of the primordial ventricular wall (prim) and trabecular muscle (trab) are indicated with an arrow. (I) Surface myocardium of a 42dpf amhc:CreER; priZm heart treated with 4-HT at 1dpf. A labeled region of the ventricular cortical myocardium (cort) is indicated with an arrow. Scale bars: 100µm in I; 50µm in A,B,D,E,G,H; 25µm in C-C′. |
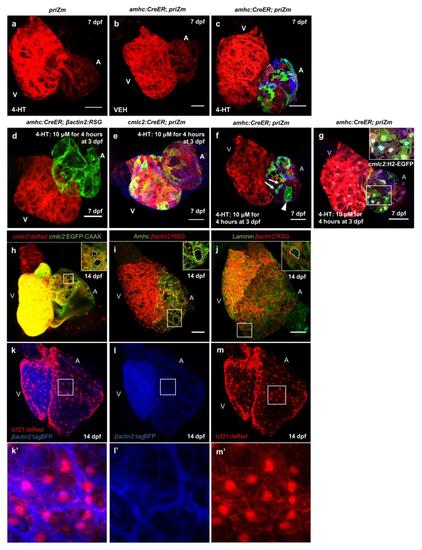
amhc:CreER-mediated recombination of the priZm cassette fluorescently labels individual zebrafish atrial cardiomyocytes. (a-c) Surface myocardium images of 7 dpf priZm hearts with and without the amhc:CreER transgene and after 4-HT or vehicle (VEH) treatment. (d) Surface myocardium of a 7 dpf amhc:CreER; βactin2:RSG heart after treatment with 4-HT at 3 dpf. (e) Surface myocardium of a 7 dpf cmlc2:CreER; priZm heart after treatment with 4-HT at 3 dpf. Scale bars are 50 µm. (f) Surface myocardium of a 7 dpf amhc:CreER; priZm heart from a larva treated with 4-HT at 3 dpf. Labeled cardiomyocytes are present in singlet (arrowhead) and doublet (arrows) clones. (g) Atrial cardiomyocytes from a 7 dpf amhc:CreER; priZm heart with nuclei marked by cmlc2:H2-GFP. Scale bars are 50 µm. (h) 3D reconstruction of a 14 dpf heart from an animal expressing the cmlc2:dsRed and cmlc2:EGFP-CAAX transgenes. Non-myocardial regions of the atrial wall are indicated (dotted lines). (i, j) Surface myocardium of 14 dpf hearts expressing βactin2:RSG and immunostained for Atrial myosin heavy chain (Amhc) or Laminin, respectively. A non-myocardial region of the atrial wall is indicated with dotted lines. Laminin immunofluorescence covers the entire atrial surface. Scale bars are 50 µm. (k-m) Surface of a 14 dpf heart from an animal expressing the epicardial reporter tcf21:dsRed and the myocardial reporter βactin2:tagBFP. Epicardial cells coat the entire atrial surface, whereas there are myocardial gaps. White boxes indicate magnified area. |
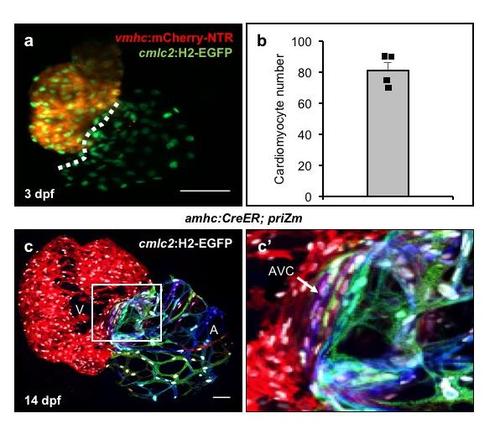
Embryonic atrial cardiomyocytes contribute to the atrial wall and atrio-ventricular canal. (a) Maximum intensity projection of a z-stack from a 3 dpf heart expressing vmhc:mCherry-NTR and cmlc2:H2-EGFP. (b) Number of atrial cardiomyocytes in 3 dpf zebrafish hearts (mean +/- SEM, n = 4, with individual data points shown). (c) Surface myocardium from a 14 dpf amhc:CreER; priZm; cmlc2:H2-EGFP heart. An expanded view of the AV canal (AVC), dense with cardiomyocyte nuclei (white), is shown. Scale bars are 50 µm. |

amhc:CreER-expressing cardiomyocytes are transient and localized to the ventricular apex and atrio-ventricular junction. (a) Surface myocardium of a 7 dpf amhc:CreER; β-actin2:RSG heart from an animal treated with 4-HT for 1 hour at 3 dpf, indicating areas of EGFP fluorescence. (b) Percentage of the ventricular surface area with EGFP fluorescence in 7 dpf amhc:CreER; β-actin2:RSG hearts, after treatment with 4-HT at 3 dpf for 1 hour (n = 11 hearts), 5 hours (n = 14 hearts) or 16 hours (n = 9 hearts) (mean +/- SEM). Differences in the means are not significant (ns) by one-way ANOVA (p > 0.05) after arcsine transformation. (c, c′) Surface myocardium of a 5 dpf vmhc:mCherry-NTR heart stained for Amhc, immunofluorescence, indicating no detectable ventricular Amhc. (d, e) Surface myocardium of a 2 dpf amhc:EGFP; vmhc:mCherry-NTR heart indicating some amhc:EGFP fluorescence in the ventricle. White bar indicates measured region for fluorescent intensity profile. Graph plots mCherry and EGFP fluorescent intensity in arbitrary units from 0-256 with position on x-axis indicating distance along the white line in (D). Blue bar indicates a region of EGFP and mCherry co-expression. Scale bars are 50 µm. (f-h) Images of 3 dpf hearts from vmhc:mCherry-NTR animals injected immediately after fertilization with a linearized plasmid containing an EGFP sequence preceded by a 4.5 kb region of the amhc promoter. Arrows indicate regions of EGFP fluorescence in the ventricle. Scale bars are 50 µm. (i-n) Surface myocardium of 7 dpf hearts (front and back) from amhc:CreER; priZm animals treated with 4-HT for 24 hours immediately after fertilization. Non-red cardiomyocytes in the ventricle are outlined in white. (o) Cartoon of generic 7 dpf ventricle overlaid with outlines from (C-H) to demonstrate localization of labeled ventricular cardiomyocytes. (p) Surface myocardium of a 7 dpf heart from an amhc:CreER; priZm animal treated with 4-HT for 24 hours immediately after fertilization. Scale bar is 50 µm. (q) Percentage of the ventricular surface area expressing non-red fluorescent proteins at 7 dpf when treated with 4-HT after fertilization (mean +/- SEM, n = 11 hearts). |