
- Title
-
PCP Signaling between Migrating Neurons and their Planar-Polarized Neuroepithelial Environment Controls Filopodial Dynamics and Directional Migration
- Authors
- Davey, C.F., Mathewson, A.W., Moens, C.B.
- Source
- Full text @ PLoS Genet.
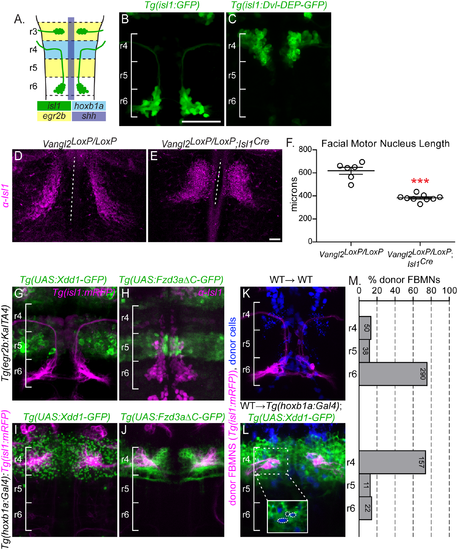
PCP signaling is required within FBMNs and in their r4 environment. (A) Schematic showing a dorsal view of a 48 hours post fertilization (hpf) zebrafish hindbrain with anterior to the top. Facial Branchiomotor neurons (FBMNs) (green) migrate posteriorly from rhombomere (r) 4 to r6, leaving a trailing axon that exits from r4. The enhancer element islet-1 (isl1) CREST drives expression in branchiomotor neurons (green); the hoxb1a element drives expression in r4 (light blue); egr2b drives expression in r3 and r5 (yellow) and shh drives expression in the floorplate (purple). (B,C, G-L) Live or (H) fixed confocal images showing dorsal views of the hindbrain of 48 hpf zebrafish embryos with anterior to the top. Brackets mark rhombomere (r) position. Scale Bar: 50μm (B) Tg(isl1:GFP) expression in a wild type embryo at 48 hpf. (C) Tg(isl1:Dvl-DEP-GFP) embryo with unmigrated Dvl-DEP-GFP-expressing FBMNs in r4. (D,E) Dorsal view of E12.5 mouse hindbrains with FBMNs (magenta) labeled with anti-Isl1 antibody. Dotted lines indicate the length of facial motor nucleus. Scale Bar: 100μm (D) Migrating FBMNs in Vangl2LoxP/LoxP control embryos. N = 6 embryos. (E) Blocked FBMNs in Vangl2LoxP/LoxP;Isl1Cre embryos. N = 9 embryos. (F) Quantitation of FBMN migration stream length in Vangl2LoxP/LoxP control embryos and Vangl2LoxP/LoxP;Isl1Cre embryos. ***p = 0.0003. Significance was determined using an unpaired, two-tail t-test. (G-L) FBMNs (magenta) are either expressing Tg(isl1:mRFP)(G,I-L) or are stained with anti-Isl1 (H). (G,H) Tg(egr2b:KalTA4)-driven expression of Tg(UAS:Xdd1-GFP) (G) and Tg(UAS:Fzd3aΔC-GFP) (H), throughout r3 and r5 does not block FBMN migration. (I,J) Tg(hoxb1a:Gal4)-driven expression of Tg(UAS:Xdd1-GFP) (I) and Tg(UAS:Fzd3aΔC-GFP) (J), throughout r4 blocks FBMN migration out of r4. (K,L) Chimeric embryos with transplant conditions indicated as donor→ host. Cascade blue-dextran marks all donor-derived cells (blue) and Tg(isl-1:mRFP) marks all donor-derived FBMNs (magenta). (K) Wild type donor-derived FBMNs migrate normally in a non-transgenic control host. N = 37 embryos, 378 FBMNs. (L) Wild type donor-derived FBMNs fail to migrate out of r4 that is expressing Tg(UAS:Xdd1-GFP). N = 26 embryos, 190 FBMNs. Inset: same image without the magenta channel showing that donor-derived FBMNs (blue, circled) are not themselves expressing Xdd1-GFP (green). (M) Histograms indicate the percent of donor-derived FBMNs at 48 hpf that failed to migrate (r4), migrated partially (r5) or migrated fully (r6). Each histogram corresponds to the chimeric condition in the image to its left and numbers indicate the number of FBMNs represented in each bar. |
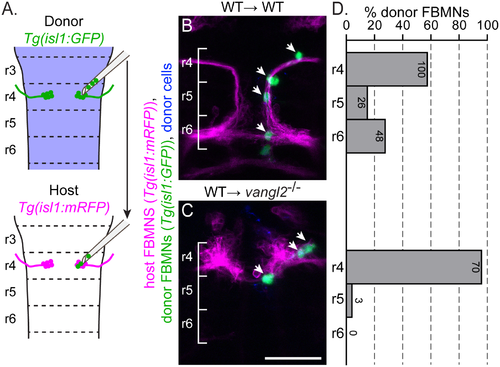
Post-mitotic FBMNs require PCP signaling for migration. (A) Schematic of the late stage FBMN transplantation procedure in which a small number (1–5) of post-mitotic, pre-migratory FBMNs are moved from r4 of a Tg(isl1:GFP) donor into r4 of a stage-matched, 16 hpf Tg(isl1:mRFP) host. (B, C) Live confocal images showing dorsal views of chimeras at 48 hpf with anterior to the top. Transplant conditions are indicated as donor→host. Cascade blue-dextran marks all donor-derived cells (blue), Tg(isl1:mRFP) marks host FBMNs (magenta) and Tg(isl1:GFP) marks donor-derived FBMNs (green). White arrows indicate donor-derived FBMNs at 48 hpf. (D) Quantitation of the percent of donor-derived FBMNs at 48 hpf that failed to migrate (r4), partially migrated (r5) or fully migrated (r6). Each histogram refers to the transplant condition in the image to its left and numbers indicate the number of FBMNs represented in each bar. WT→WT, N = 42 embryos, 174 FBMNs; WT→ vangl2-/-, N = 16 embryos, 73 FBMNs. ***p<0.0001 compared to WT→WT control. Brackets indicate rhombomere location. Scale bar: 50μm. |
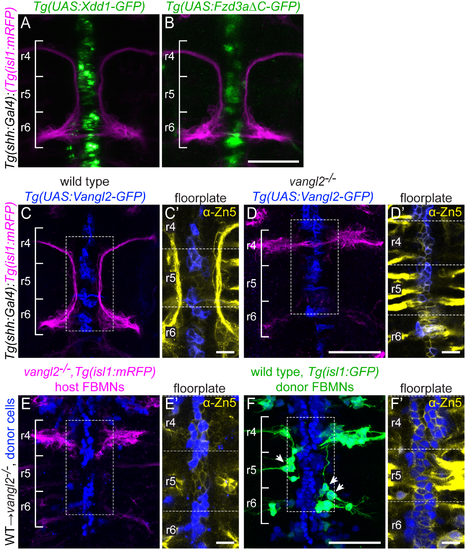
Floorplate PCP is neither required nor sufficient for FBMN migration but can support the migration of WT FBMNs. Confocal images showing dorsal views of 48 hpf hindbrains with anterior to the top. (A,B) Tg(shh:Gal4)-driven expression of Tg(UAS:Xdd1-GFP) (A) and Tg(UAS:Fzd3aΔC-GFP) (B) does not disrupt FBMN (magenta) migration. N = 13 Xdd1-GFP expressing embryos and 26 Fzd3aΔC-GFP expressing embryos. (C,D) Tg(shh:Gal4)-driven floorplate expression of GFP-Vangl2 (blue) in the floorplate of a wild type sibling does not disrupt FBMN migration (magenta) (C) and does not rescue migration in a vangl2 mutant (D). N = 24 vangl2 mutants with GFP-Vangl2 expression in the r4 floorplate, 14 with 5 or more expressing floorplate cells in r4. (C',D') Boxed regions from panels C and D respectively, showing a single z-plane where GFP-Vangl2 (blue) is expressed broadly in floorplate cells whose membranes are marked with the Zn5 antibody (yellow) [69]. (E,F) Genetic chimeras. Cascade blue-dextran marks all donor-derived cells (blue), Tg(isl1:mRFP) marks host FBMNs (magenta in E) and Tg(isl1:GFP) marks wild type donor-derived FBMNs (green in F). (E) The presence of wild type floorplate cells (blue) in a vangl2 mutant host embryo does not rescue the migration of host FBMNs. N = 16 embryos with extensive contribution of WT cells to the floorplate. (F) The presence of wild type floorplate cells (blue) in a vangl2 mutant can, however, support the migration of co-transplanted wild type donor derived FBMNs (green, arrows). N = 8 embryos with migrated donor-derived FBMNs/22 embryos with donor-derived FBMNs; N = 76 migrated FBMNs/383 total donor-derived FBMNs. (E',F') Single Z-planes of the boxed regions from panels E and F respectively, show that donor-derived cells (blue) are in the Zn-5-positive floorplate (yellow). Scale bars: 50 μm, 5μm in the insets. |

Polarization of PCP protein localization in the migratory environment. (A-A'') Dorsal view with anterior to the top of a 24 hpf wild type floorplate at the level of r4 co-immunostained with anti-Vangl2 (green) and anti-ZO-1 (magenta), a marker of apical tight junctions. The boxed regions in A are examples of anterior-posterior membranes (AP) (61–90° from AP axis), intermediate membranes (I) (31–60° from AP axis) and lateral membranes (L) (0–30° from AP axis). Arrows in A'' indicate enrichment of anti-Vangl2 labeling at AP membranes. (B) Quantitation of fluorescent intensity of anti-Vangl2 labeling for AP, I and L membranes. N = 5 embryos, 192 membranes (57 L, 47 I, 88, AP). Graph represents data as mean ± SEM. *p = 0.018, ****p<0.0001; Significance was determined using a paired two-tail t-test with Welch's correction. (C-D) Live lateral views of 48 hpf wild type floorplate cells at the level of the spinal cord with mosaic expression of GFP-Vangl2 (C) and Fzd3a-GFP (D). Anterior is to the left and dorsal/apical is up; white dots indicate the center of each expressing floorplate cell, arrows indicate anterior subapical membrane enrichment of GFP-Vangl2 (C) and posterior subapical enrichment of Fzd3a-GFP (D). (E-E'') Dorsal view of the apical surface of floorplate cells in a 48 hpf embryo expressing GFP-Vangl2 (green) and stained for ZO-1 (magenta) Anterior is to the left; white dots indicate the center of the expressing cell. Arrows in E'' indicate anterior enrichment of GFP-Vangl2. (F-F'') En face view of the apical endfeet of neuroepitheilial cells in r4 of a 24 hpf embryo expressing GFP-Vangl2 (green) and stained for ZO-1 (magenta). Anterior is to the left; white dot indicates the center of the expressing cell. Arrow in F'' indicates anterior enrichment of GFP-Vangl2. N = 17 embryos, 23 cells. Scale bars: 5 μm. |
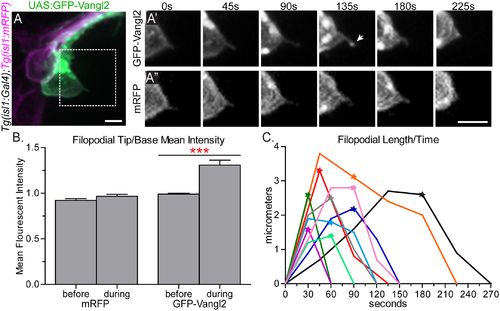
GFP-Vangl2 is enriched to the tip of retracting FBMN filopodia. (A) Live confocal image of a single GFP-Vangl2 expressing FBMN (green) in a Tg(isl1:mRFP) (magenta) 24 hpf embryo. Scale bar: 10 μm. (A',A'') Magnified views of the boxed region in A of the individual channels, GFP-Vangl2 and Tg(isl1:mRFP) respectively, at the time points indicated. The arrow in E' indicates enrichment of GFP-Vangl2 at the filopodial tip. Scale bar: 10 μm. (B) Quantitation of filopodia tip/base mean fluorescent intensity ratio for mRFP and GFP-Vangl2 at the time-point before and during GFP-Vangl2 enrichment. Before enrichment the mean fluorescent intensity ratio of GFP and mRFP at the filopodia tip versus the filopodia base is approximately 1 (N = 9 filopodia). During the enrichment event this ratio for GFP-Vangl2 is 1.31 while the ratio remains close to 1 for mRFP (N = 12 filopodia). (C) Plot showing the change in filopodial length over time for 10 filopodia. The stars indicate the time-point that GFP-Vangl2 is enriched at each filopodium tip. The black trace corresponds to the filopodium in A',A''. Graph represents data as mean ± SEM. ***p<0.001; Significance was determined using an unpaired, two-tail t-test with Welch's correction. |
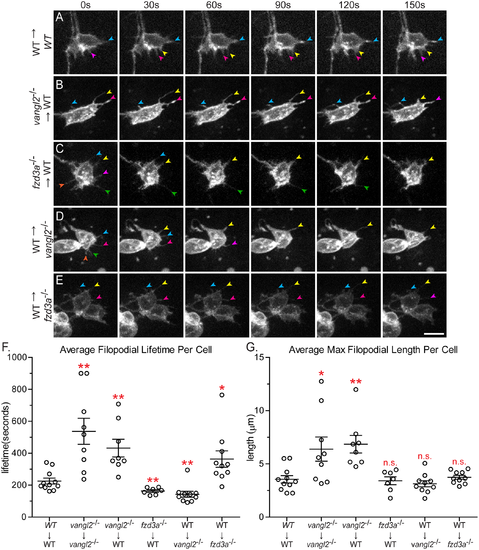
Vangl2 and Fzd3a have opposing cell-autonomous and non-cell-autonomous roles in modulating filopodial dynamics. (A-E) Time-lapse spinning-disc confocal series of donor-derived FBMNs in chimeric embryos at 24–30 hours post-fertilization (hpf). Transplant conditions are indicated on the left as donor→host. Colored arrows indicate individual filopodia at different time-points. Anterior is to the top and medial is to the right. Scale bar: 5 μm. (F) Quantitation of filopodial lifetime for donor-derived FBMNs. Each data point is an average of all the filopodial lifetimes for one FBMN. (G) Quantitation of the maximum filopodial length for donor-derived FBMNs. Each data point is the average maximum length for all the filopodia of one FBMN. WT→WT: N = 6 embryos, 11 neurons (3 in r4, 4 in r5, 4 in r6), 70 filopodia; vangl2-/-→vangl2-/-: N = 6 embryos, 9 neurons, 43 filopodia; vangl2-/-→WT: N = 6 embryos, 8 neurons, 44 filopodia; fzd3a-/-→WT: N = 7 embryos, 7 neurons, 73 filopodia; WT→ vangl2-/-: N = 8 embryos, 10 neurons, 152 filopodia; WT→ fzd3a-/-: N = 6 embryos, 10 neurons, 65 filopodia. Graphs represent data as mean ± SEM. *p<0.05, **p<0.01 compared to WT→WT control; n.s., not significant. Significance was determined using an unpaired, two-tail t-test with Welch’s correction. |

Fzd3a has a cell-autonomous function in FBMN migration. (A-B) Live confocal images of 48 hpf chimeric embryos with anterior to the top. Transplant conditions are indicated as donor→host. Pk1bMO host embryos were used because they have normal neuroepithelial planar polarity but unmigrated FBMNs; this prevents donor-derived FBMNs from being carried to r6 by migrating host neurons in a PCP-independent manner. Cascade blue-dextran marks all donor-derived cells (blue), Tg(isl1:mRFP) marks host FBMNs (magenta) and Tg(isl1:GFP) marks donor-derived FBMNs (green). Histograms on the right indicate the percent of donor-derived FBMNs at 48 hpf that failed to migrate (rhombomere (r)4), partially migrated (r5) or fully migrated (r6) and numbers indicate the number of FBMNs represented in each bar. N indicates the number of chimeric embryos and n indicates the number of FBMNs scored in each condition. Brackets indicate rhombomere positon. Scale bar: 50 μm. |
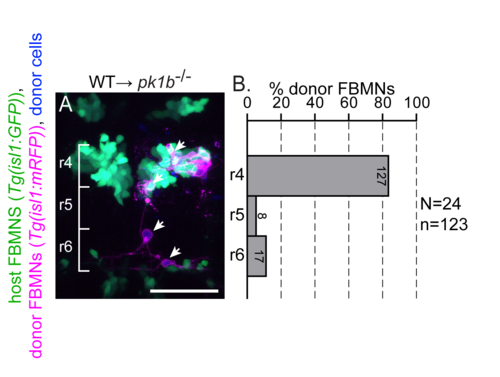
Post-mitotic FBMNs require PCP signaling for migration. (A) Live confocal image showing the dorsal view of a pk1b mutant embryo hindbrain at 48 hpf after transplantation of post-mitotic FBMNs from a wild type donor. Cascade blue-dextran marks all donor-derived cells (blue), Tg(isl1:GFP) marks host FBMNs (green) and Tg(isl1:mRFP) marks donor-derived FBMNs (magenta). (B) Histogram indicates the percent of donor-derived FBMNs at 48 hpf that failed to migrate, (rhombomere (r)4), partially migrated (r5) or fully migrated (r6) and numbers indicate the number of FBMNs represented in each bar. White arrows indicate migrated donor derived FBMNs. While post-mitotic FBMNs in general migrate poorly after being transplanted, they do sometimes migrate in WT and pk1b mutant hosts but never in vangl2 mutant hosts (see Fig 2). Brackets indicate rhombomere positon. Scale bar: 50μm. |

PCP-DN expression in the floorplate disrupts planar polarity. (A-C) Tg(shh:Gal4) driven expression of Tg(UAS:Kaede) in the notochord and floorplate of a 14 hpf (A) 24 hpf embryo (B) and a 48 hpf embryo (C). Anterior is to the left. Images are live lateral views in A-C and live dorsal views at the hindbrain level, A',B'. (D-F) Confocal images showing floorplate planar polarity of the anterior spinal cord in 48 hpf zebrafish embryos. Anterior is to the top. Anti-ZO-1 marks subapical tight junctions (white), anti-Cc2d2a marks the basal bodies of the primary cilia (magenta, arrows), and anti-GFP indicates dominant negative protein expression (green). Scale bar: 10μm. Whereas basal bodies are localized toward the posterior membrane in wild type embryos (D), this polarity is disrupted in floorplate cells expressing Xdd1-GFP (E) or Fzd3aΔC-GFP (F) (arrows in E' and F'). (G) Schematic of the method used to quantify floorplate planar polarity. Total cell length (x) is measured as the distance between the anterior and posterior membranes (white) at the level of the basal body (magenta). Basal body position (y) is measured as the distance between the anterior membrane and the basal body. Cellular planar polarity is quantified as the ratio of x/y. (H) Quantitation of average basal body position in the floor plate of 48 hpf embryos. Each data point represents the mean basal body position for all cells quantitated in a single embryo. WT: N = 34 embryos, 411 cells; Xdd1-GFP: N = 14 embryos, 207 expressing cells; FzdΔC-GFP: N = 29 embryos, 484 expressing cells; vangl2-/-: N = 10 embryos, 96 cells. Quantitation of floorplate polarity in vangl2-/- embryos is included for comparison. Graph represents data as mean ± SD. **p<0.0001 compared to wild-type control. |

Specificity of the anti-Vangl2 antibody. (A-B) Dorsal view of wild type (A) and vangl2 mutant (B) 24 hpf neural tubes immunostained with anti-Vangl2-NT (green). The neuroepithelial membrane staining visible in wild type is absent in the mutant. (C) Western blot analysis of whole embryo lysates with anti-Vangl2 antibody. Anti-alpha-tubulin was used as a loading control. Zebrafish Vangl2 is expected to run at approximately 60kDa. For the anti-Vangl2 blot there is a band that is present in the wild type and absent in the vangl2 mutant, see asterisk. |
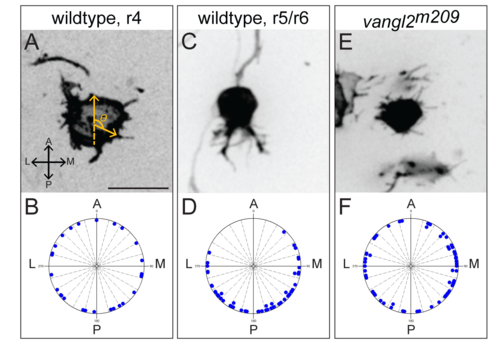
Migrating FBMNs display polarized protrusions that fail to polarize in vangl2 mutants. (A,C,E) Representative frames of mTFP expressing FBMNs from time-lapse images taken at 24 hpf to 32 hpf. (B,D,F) Each raw data point for protrusion angle is plotted on the circular graph below. Each division is 10 degrees. A, anterior. P, posterior. M, medial. L, lateral. Filopodia are radial in wild type FBMNs prior to exiting r4 (A,B, N = 3 embryos, 5 neurons, 28 filopodia) and become polarized to the posterior side of the cell during migration (C,D, N = 8 embryos, 10 neurons (6 in r5 and 4 in r6), 52 filopodia). FBMN protrusions fail to polarize in vangl2 mutants (E,F, N = 5 embryos, 7 neurons, 61 protrusions). Scale bar: 16μm. |

The effect of PCP on protrusion dynamics is dependent on the migratory environment. (A) Method used to isolate and identify FBMNs in primary culture. Embryos used were Tg(isl1:mTFP);Tg(hoxb1a:RFP) allowing for the differentiation between FBMNs and other branchiomotor neurons labeled by Tg(isl1:mTFP). (B,C) Cultured Tg(isl1:mTFP); Tg(hoxb1a:RFP) FBMNs from a wild type (B) and a vangl2 mutant embryo (C). (B',C') Time-lapse spinning-disc confocal series of boxed region from B and C. (D) Quantitation of filopodial lifetime for cultured FBMNs. Each timelapse was 600 seconds total. p = 0.9044, n.s. (E) Quantitation of the maximum filopodial length for cultured FBMNs. p = 0.0856, n.s. Wild type: N = 8 neurons, 64 filopodia. vangl2-/-: N = 8 neurons, 61 filodpodia. Graphs represent data as mean ± SEM. Each data point is the average lifetime (D) or maximum length (E) for all the filopodia of one FBMN. Significance was determined using an unpaired, two-tail t-test with Welch’s correction. |