
- Title
-
Chemical Biology in the Embryo: In Situ Imaging of Sulfur Biochemistry in Normal and Proteoglycan-Deficient Cartilage Matrix
- Authors
- Hackett, M.J., George, G.N., Pickering, I.J., Eames, B.F.
- Source
- Full text @ Biochemistry

Alcian blue staining suggests a correlation between sulfated proteoglycan levels and chondrocyte differentiation. Regions of cartilage that have mature chondrocytes, such as the middle of this developing zebrafish hyosymplectic (A, arrow), show decreased levels of Alcian blue staining. Compared to wild-type levels of Alcian blue staining of the developing zebrafish ceratohyal (B), proteoglycan synthesis mutants, such as this fam20b mutant, have decreased levels of Alcian blue staining and also early chondrocyte maturation and perichondral bone (C, arrow). |
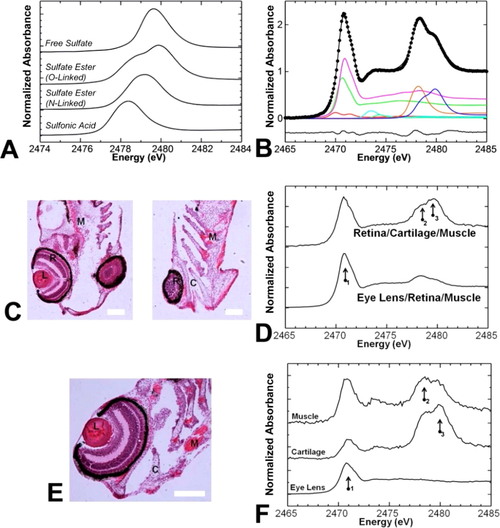
K-Edge of sulfur that is sensitive to oxidation state and chemical form. (A) Sulfur K-edge XAS spectra of model compounds representing sulfur species possible in cartilage. In particular, sulfates have different spectral features depending on their chemical form (free, N-linked ester, or O-linked-ester). (B) Least-squares fits of bulk zebrafish tissues do not detect free or N-linked sulfate, only O-linked sulfate. Color scheme: thiol, green; thio-ether, pink; disulfide, red; sulfoxide, light blue; sulfonic acid, orange; O-linked sulfate ester, dark blue. Raw data are shown as black circles, the fit is shown as a black line. The residual is shown below the spectra. (C and D) Bulk measurements performed on zebrafish tissue sections cut at different planes detect chemical differences that correlate to tissue structures present in the sample (i.e., more sulfate esters when more cartilage is present, more thio-ether when eye lens is present). (E and F) µ-XAS can be used to prove chemical speciation on a fine spatial scale (e.g., 10 µm × 10 µm region) and detect chemical differences among eye lens, cartilage, and muscle; locations from which µ-XAS (F) were measured are indicated on the histological image (E). Abbreviations for panels C and E: C, cartilage; L, eye lens; M, muscle; R, retina. Arrows numbered 1-3 in panels E and F highlight the positions of maximal absorbance due to thio-ethers, sulfonic acids, and sulfate esters, respectively, which are most abundant in the eye lens, muscle tissue, and cartilage tissue, respectively. The scale bar in panel C is 20 µm, and the scale bar in panel E is 50 µm. |

Chemically specific imaging reveals the distribution of O-linked sulfate esters. Because of the characteristic shifts in the edge position and intensity of different chemical forms of sulfur, multienergy chemically specific imaging can be performed to elucidate the distribution of specific chemical forms of sulfur (i.e, O-linked sulfate esters). In this example, two chemical forms of sulfur are revealed using a four-energy imaging approach. (A) H&E stain. (B–E) Sulfur XFI maps at four specified energies: (B) 2475 eV, background; (C) 2478.2 eV, white line position of sulfonic acid; (D) 2479.8 eV, white line position of sulfate ester; (E) 2510 eV, total sulfur, displayed on a relative intensity scale. (F) Total phosphorus, measured simultaneously with sulfur. (G and H) Chemically specific images, displayed on a common intensity scale, of sulfonic acid and O-linked sulfate esters, respectively. (I) Overlay of total sulfur (red), total phosphorus (blue), and sulfate esters (green). Empty arrowheads indicate the locations of cartilage, and filled arrowheads indicate the locations of muscle tissue (intense pink eosin staining). The scale bar is 10 µm. |
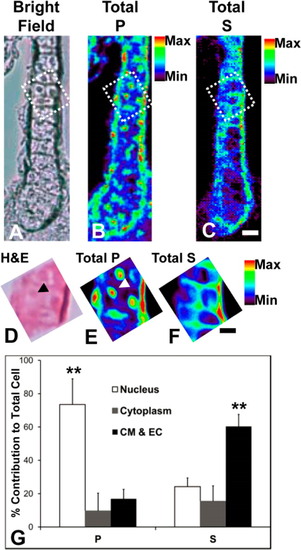
XFI of cartilage in larval zebrafish reveals subcellular compartmentalization. (A) Bright field imaging of the unstained cartilage prior to XFI analysis. (B and C) XFI elemental map of total phosphorus (P) and sulfur (S) distributions at 1 µm steps within cartilage. (D) H&E histology of the region analyzed at high resolution, which is outlined by a dashed line in panel A. (E and F) High-resolution (100 nm beam size and steps) XFI analysis of the P and S subcellular distribution in cartilage. (G) Quantification of P and S concentrations within subcellular compartments of cartilage (CM, cell membrane; EC, extracellular matrix). A Student’s t test at the 95% confidence limit was used to test for significant differences between groups. *p < 0.05, and **p < 0.01. Scale bars are 10 µm in panel C and 5 µm in panel F. |
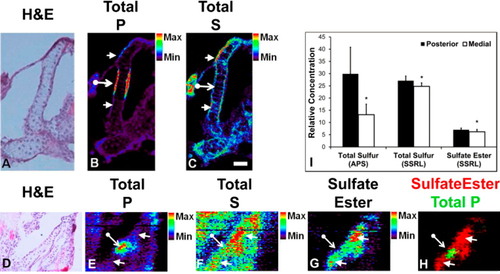
Phosphorus, sulfur, and sulfate ester distributions show significant variations during cartilage development. As development progresses, bone begins to form along the edge of cartilage, beginning in the middle segment. (A) H&E histology of the cartilage imaged with XFI at the APS in panels B and C. (B) Total phosphorus (P) distribution highlighting a high P level in the middle of the cartilage element (long arrow) and a low P level at the posterior and anterior ends (short arrowheads). (C) Total sulfur (S) distribution showing low S in the middle of the cartilage element (arrow) and a high S level at the posterior and anterior ends (arrowheads). (D) H&E histology of the cartilage element imaged with chemically specific XFI at SSRL (E-H). (E) Total P image from chemically specific XFI highlighting the high P level in the middle of the cartilage element (arrow) and the low P level at the posterior and anterior ends (arrowheads). (F) Total S distribution showing the low S level in the middle of the cartilage element (arrow) and the high S level at the posterior and anterior ends (arrowheads). (G) Chemically specific XFI sulfate ester distribution showing the low sulfate ester content in the middle of the cartilage element (arrow) and the high sulfate ester content at the posterior and anterior ends (arrowheads). (H) Overlap of the P (green) and sulfate ester (red) distribution. (I) Quantitative analysis of the total S and sulfate ester content of posterior and medial cartilage regions. Total sulfur was measured at two different synchrotron facilities, the Advanced Photon Source (APS) and the Stanford Synchrotron Radiation Lightsource (SSRL), and the same scientific conclusion was reached in each case. The data are presented as the relative concentration (fluorescence yield). A Student’s t test at the 95% confidence limit was used to test for the significant difference between groups. *p < 0.05. The scale bar is 10 µm. |
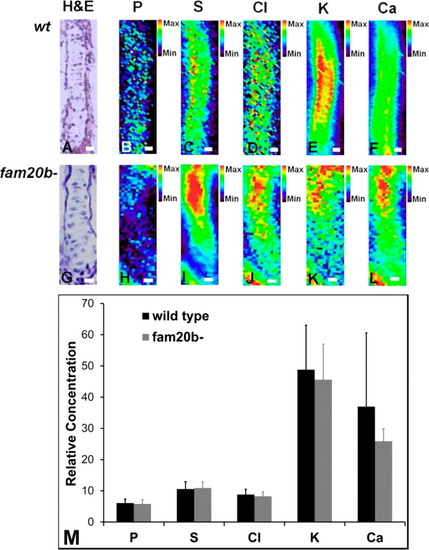
Mutation of PG synthesis has no significant effect on total elemental content. This figure compares the elemental levels and distribution in cartilage from wild-type (A-F) and fam20b- mutant (G-L) fish. After quantitation (M), there were no differences in total sulfur [or any other element (P, Cl, K, and Ca)] from data collected at 3 µm steps, in a 5 µm × 7 µm beam. A Student’s t test at the 95% confidence limit was used to test for significant differences between groups. The scale bar is 5 µm. XFI elemental maps were collected at the CLS. The data are presented as relative concentration (fluorescence yield). |

Chemically specific sulfur imaging shows a significant difference in sulfate ester, but not total sulfur, content in mutant (fam20b-) cartilage compared with wild-type cartilage: (A-E) wild type and (F-J) fam20b- mutant. (A and F) H&E histology. (B and G) Total phosphorus. (C and H) Total sulfur. (D and I) Sulfonic acids. (E and J) O-linked sulfate-esters. The scale bar is 5 µm. (K) Quantification of total sulfur and sulfate esters in cartilage. A Student’s t test at the 95% confidence limit was used to test for significant differences between groups. *p < 0.05. The data are presented as relative concentration (fluorescence yield). (L) µ-XAS of wild-type vs fam20b- cartilage, suggesting that while levels of sulfate esters are lower in the mutant (right arrow), levels of thiols and/or disulfides are higher (left arrow). |

FTIR spectroscopic imaging reveals a significant increase in total protein levels in cartilage from PG-deficient fam20b- mutant fish relative to wild-type fish. (A) FTIR spectroscopic images of total protein in wild-type and fam20b- mutant fish were generated from the integrated area under the amide I band (1600-1700 cm-1). (B) Representative average FTIR spectra from the entire cartilage region of interest in one wild-type fish and one fam20b- mutant fish. (C) Average values calculated from the integrated area under the curve for the amide I band (1600-1700 cm-1), the ester carbonyl band (1755-1715 cm-1), and the amide I/ester carbonyl ratio. The integrated area under the curve values for the ester carbonyl band have been multiplied by a factor of 10 for the sake of clarity. |
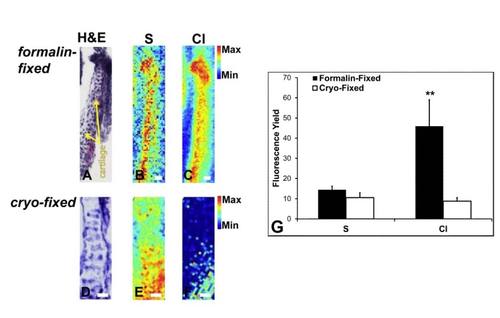
Formalin-fixation causes alterations in chlorine distribution. Alterations in Cl distribution are seen when the sample is formalin-fixed (A-C) as an additional sample preparation step prior to flash freezing cartilage, in comparison with no formalin-fixation (D-F). The quantitative comparison is given in (G). ** indicates significantly increased Cl in samples formalin-fixed prior to cryo-fixation, p < 0.01, Student’s t-test, 95% confidence. |

Regions of interest drawn onto anterior, medial and posterior cartilage sections for Figure 5, and regions of interest drawn for entire cartilage sections for Figure 6 and 7. |