
- Title
-
Pdgfra and Pdgfrb genetically interact during craniofacial development
- Authors
- McCarthy, N., Liu, J.S., Richarte, A.M., Eskiocak, B., Lovely, C.B., Tallquist, M.D., Eberhart, J.K.
- Source
- Full text @ Dev. Dyn.
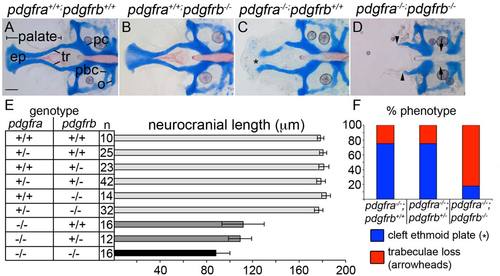
pdgfra and pdgfrb interact during craniofacial development. A-D: Five days postfertilization flatmounted zebrafish neurocrania. Anterior is to the left. A-C: Wild-type (A) and pdgfrb mutants (B) display normal craniofacial skeletons, while pdgfra mutants (C) display a shortened neurocrania and cleft palate (asterisk). D: pdgfra;pdgfrb double mutants lose the palatal skeleton (arrowheads) and a region of the parachordals adjacent to the posterior basicapsular commissure (arrows). E: Bar chart depicting neurocranial length measured from the anterior ethmoid plate to the posterior occipital arch of the neurocranium. Similarly shaded bars are not significantly different from one another (ANOVA, P ≤ 0.05). F: Bar chart depicting percent of phenotypes observed per genotype listed showing higher percentage of pdgfra-/-;pdgfrb-/- mutants displaying trabeculae loss, blue bar depicts cleft ethmoid plate (asterisk in C) and red bar depicts loss of trabeculae (arrowheads in D). ep, ethmoid plate; o, occipital arch; pbc, posterior basicapsular commissure; pc, parachordals; tr, trabeculae. Scale bar = 20 µm. PHENOTYPE:
|
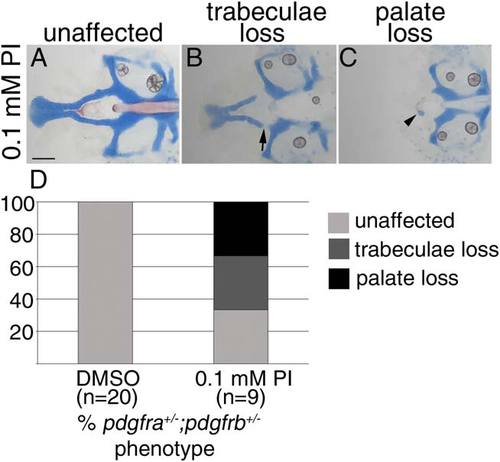
Craniofacial development is sensitive to Pdgf signaling loss between 10 and 30 hpf. A-C: Five dpf flatmounted pdgfra+/-;pdgfrb+/- zebrafish neurocrania, exposed to 0.1 mM Pdgf Inhibitor V (PI) from 10 to 30 hpf, anterior to the left. D: Bar chart depicting percentage of pdgfra+/-;pdgfrb+/- embryos displaying unaffected (light gray bar, A), trabeculae loss (dark gray bar, arrow in B), or palate loss (black bar, arrowhead in C) craniofacial defects in DMSO or 0.1 mM Pdgf Inhibitor V (PI). Scale bar = 20 µm. PHENOTYPE:
|
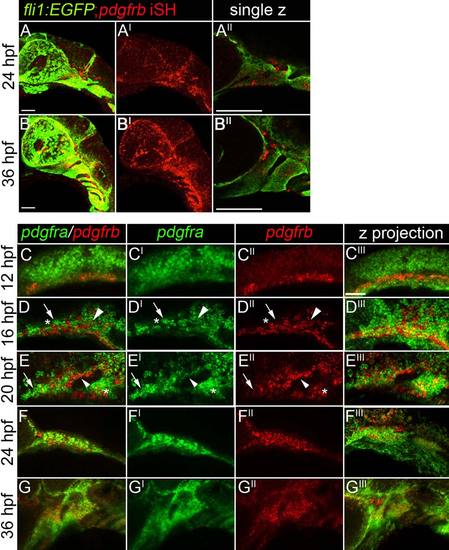
Neural crest cells express both pdgfra and pdgfrb. A-A′′: A 24 hpf fli1:EGFP transgenic embryo labeled for pdgfrb mRNA by means of fluorescence in situ hybridization, anterior is to the left. B-B′′: A 36 hpf fli1:EGFP transgenic embryo and labeled for pdgfrb mRNA by means of fluorescence in situ hybridization, anterior is to the left. C-G′′′: A 12 (C-C′′′), 16 (D-D′′2), 20 (E-E′′′), 24 (F-F′′′), 36 (G-G′′′) hpf embryo stained for both pdgfra and pdgfrb mRNA by means of fluorescence in situ hybridization. The neural crest expresses pdgfra (Eberhart et al., 2008), while pdgfrb is restricted medial and ventral to pdgfra expression at 12 hpf. At 16 hpf, cells singly positive for either pdgfra or pdgfrb are observed within the crest stream (D-D′′, arrow and asterisk, respectively). We also observe cells doubly positive within the stream (Arrowhead). More extensive co-expression of pdgfra and pdgfrb is observed at 20, 24, and 36 hr postfertilization (arrowheads in E-E′′). Scale bar = 20 µm. EXPRESSION / LABELING:
|

Maxillary CNCC fail to condense properly in pdgfra-/-;pdgfrb-/- embryos beginning at 24 hpf. A-C′′′: Stills of confocal movies of pdgfra+/+;pdgfrb+/+, pdgfra-/-;pdgfrb+/+, and pdgfra-/-;pdgfrb-/- embryos, respectively. Anterior is to the left. Arrowheads point to the anterior most maxillary domain. In a pdgfra-/-;pdgfrb+/+ embryo (B-B′′′), the maxillary CNCC condensation progress anteriorly throughout craniofacial morphogenesis, while in pdgfra-/-;pdgfrb-/- embryo (C-C′′′), maxillary domain CNCC fails to extend, compared with pdgfra+/+;pdgfrb+/+ (A-A′′′). Scale bar = 50 µm. |

Maxillary neural crest cells fail to extend anteriorly in pdgfra-/-;pdgfrb-/- mutants. Stills of Supplementary Movie S3 showing maxillary neural crest extending anteriorly in pdgfra-/-;pdgfrb-/- mutants early, then retracting posteriorly later (arrowhead). A gap in the condensation is also present at the beginning of the movie (arrow). Scale bar = 50 µm. |
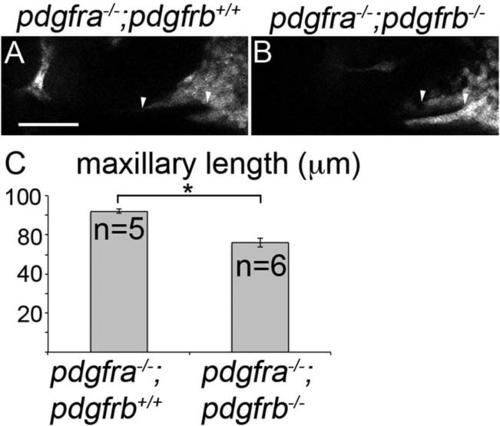
Maxillary domain CNCC length is reduced in pdgfra;pdgfrb mutants at 30 hpf. A,B: Thirty hpf single z-stack confocal images of fli1:EGFP transgenic embryos with indicated genotypes above the panels, anterior is to the left. EGFP-labeling is depicted as gray. The maxillary condensation extends further anteriorly in (A) pdgfra-/-;pdgfrb+/+ embryos compared with (B) pdgfra-/-;pdgfrb-/- embryos (arrowhead denotes length measured). C: Bar chart depicting maxillary neural crest length (Students t-test; *P = 0.0136). Scale bar = 50 µm. |
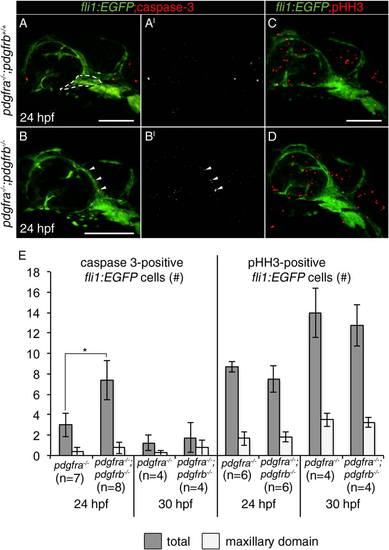
Neither cell death nor proliferation is significantly affected in the maxillary domain of pdgfra;pdgfrb mutants. A-D: The 24 hpf fli1:EGFP zebrafish embryo with corresponding genotypes listed left of panels, stained for active caspase 3 (A and B in red; A′ and B′ in gray), and phospho-histone H3 (pHH3) in (C,D). Anterior is to the left. B–B′: pdgfra-/-;pdgfrb-/- embryos show increased total cell death at 24 hpf, but not in the maxillary domain crest (arrowheads show cell death above the eye, maxillary domain is outlined in panel A). E: Bar chart representing either total (gray bars) or maxillary domain (light bars) number of active caspase 3-positive or pHH3-positive fli1:EGFP cells in corresponding genotypes (Students t-test, P ≤ 0.05). Scale bar = 100 µm. |