
- Title
-
Retinoic acid-induced premature osteoblast-to-preosteocyte transitioning has multiple effects on calvarial development
- Authors
- Jeradi, S., Hammerschmidt, M.
- Source
- Full text @ Development

Treatment with RA or the Cyp26 inhibitor R115866 leads to impaired horizontal and vertical growth of calvaria. (A-C) Alizarin Red (AR) staining of calvarial pates of untreated juvenile wild-type zebrafish at the indicated standard length (SL); dorsal view of head; anterior to the right. For details, see text. (D-F) Magnified dorsal view of central head region of SL8-9 fish treated with DMSO (D), RA (E) or R115866 (rambazole; F) for 7days, after consecutive in vivo AR staining (red) before and calcein staining (green) after the treatment. The width of the green-only region is indicated by double-headed arrows. Arrowheads in D,E mark the position of the virtual transverse projections shown in Fig. S1A,B; asterisks in E,F mark diffuse and weak green staining in patent regions of the RA- and R115866-treated fish, but not in the control, most likely representing ectopic ossification of col1a2-encoded collagen in the overlying dermis (Le Guellec et al., 2004; see Fig. S1 and Discussion). (G,H) Transverse sections through frontal plate of SL8-9 fish treated with DMSO (G) or RA (H), in vivo stained with AR before and with DAPI after the treatment. Positions of osteogenic fronts before the treatment are indicated by regular arrows (revealed by the border of the AR-positive stripes); thicknesses of the frontal plates are indicated by double-headed arrows. Note the preferential vertical growth at the inner surface of the calvaria (larger distance between AR-positive stripe of ‘old’ bone and ventral surface of calvaria). (I,J) Quantification of reduced horizontal and vertical growth, expressed as percentage of added area (I) or width (J) of DMSO-treated controls. DMSO: n=7; RA: n=6; rambazol: n=4). Mean values±s.d. are shown. ****P<0.0001. cs, coronal suture; fp, frontal plate; ifs, interfrontal suture; of, osteogenic front; pp, parietal plate; ss, sagittal suture. |

RA induces premature osteoblast-to-preosteocyte transitioning at osteogenic fronts. (A-D,F-R) Transverse sections through the osteogenic front region of a frontal calvarial plate of SL8-9 wild-type fish treated as indicated. (A,B) The number of osx-expressing cells assessed in tg(osx:NTR-mCherry) is unaltered upon RA treatment. However, at the osteogenic front, cells lose their globular shape (see insets for magnification). (C,D) Immunofluorescence with Zns5 antibody, counterstained with DAPI, reveals unaltered numbers and distributions of osteogenic cells upon RA treatment. (E) Quantification of osx- and Zns5-positive cells in corresponding regions at the osteogenic front. DMSO: n=8; RA: n=10. Mean values±s.d. are shown. (F-I) In situ hybridizations, revealing strongly impaired expression of the collagen genes col1a1 (F,G) and col10a1 (H,I) in bone-lining cells of RA-treated fish. In F,G, H2O2 treatment had been omitted, leaving the melanocytes (mc) of the meninges (Goldgeier et al., 1984) visible as black cells. (J,K) Expression of bglap as assessed in tg(bglap:GFP) is downregulated in the RA-treated samples. In K, the borders of the calvarial plate are outlined. (L-O) In situ hybridizations, revealing increased expression of spp1 (L,M) and the preosteocyte marker phex (N,O) in bone-lining cells of the RA-treated fish. (P) qRT-PCR analyses of isolated calvaria: the RA-treated sample displays a highly significant downregulation of the osteoblast markers bglap and col10a1, and a highly significant upregulation of the preosteocyte markers phex and spp1, whereas ankha and ankhb, other mammalian osteocyte markers (Franz-Odendaal et al., 2006; Laue et al., 2011), were not increased or only moderately increased. (Q,R) Double fluorescence in situ hybridization revealing coexpression of spp1 (red; single channel in Q) and phex (green; merged image in R; counterstained with DAPI in white) in bone-lining cells of RA-treated fish. **P<0.01, ***P<0.001, ****P<0.0001, ns, not significant. |

Treatment with RA or the Cyp26 inhibitor R115866 leads to calvarial bone fragmentation and ectopic osteoclast activation. (A-C) AR staining of SL9-10 fish before treatment (A) and after 7days of treatment with RA (B) or R115866 (Ramb; C); dorsal view of head region. White arrows point to similar areas at the level of the epiphyseal bar (compare with Fig. S5B), which is continuous before (A), but fragmented after (B,C) the treatment. (D,E) Consecutive in vivo AR staining directly before, and calcein (green) staining after the treatment. The newly synthesized matrix (green) at the sites of fragmentation in the RA-treated fish shows signs of hypermineralization (E; more intense green), in comparison with the newly synthesized matrix at the osteogenic front (of) of the DMSO-treated control (D). (F-I) In vivo AR staining (F,G), followed by enzymatic TRAP staining (H,I); epiphyseal bar region, anterior to the top. Ectopic TRAP is exclusively present in fragmented areas of RA-treated sample (G,I). (J-Q) Transverse sections through epiphyseal bar region showing in situ hybridization for mRNA of the TRAP-encoding gene acp5a (J,K) or enzymatic TRAP staining (L-Q). (J-M) RA-treated fish display ectopic acp5a expression and TRAP activity. (N-Q) Increased TRAP activity is displayed in corresponding regions of fish treated with the Cyp26 inhibitor R115866 (Ramb; O) and in an sst mutant, homozygous for a hypomorphic cyp26b1 mutation (Q). At this level, the calvarial plate of the sst mutant is much thinner than in the wild-type sibling (see Fig. S5E,F for magnifications). (R) qRT-PCR analysis of isolated calvarial plates: the expression of marker genes of active osteoclasts (acp5a, ctsk and rank) is significantly upregulated in RA-treated samples compared with DMSO controls. ***P<0.001, ****P<0.0001. |

Both osteoclasts and osteogenic cells are required to mediate RA-induced calvarial fragmentation. (A,B) AR staining of SL9-10 wild-type sibling (A; n=7/7) and pfe mutant (B; n=9/9) after 7days of RA treatment. Arrows point to calvarial fragmentations in the wild type and corresponding regions in pfe mutant, which lacks fragmentation. (C-F) TRAP labeling of transverse sections through epiphyseal bar (eb) region, where RA-calvarial fragmentation occurs (see Fig. S4B). In comparison with wild-type siblings (D; n=3/3), RA treatment fails to induce TRAP activity in pfe mutant (F; n=4/4), with staining comparable to the untreated WT sibling (C; n=3/3) or mutant (E; n=3/3). (G-J) Calcein staining of osx:NTRmcherry transgenic fish after MTZ treatment (I,J) for osteogenic cell ablation, and/or RA (H,J) or DMSO (G,I) treatment. After ablation of osteogenic cells (J; n=7/7), RA fails to induce calvarial fragmentation seen in the RA only-treated transgenic fish (H; n=5/5). Also, pure ablation of osteogenic cells fails to cause calvarial fragmentation (I; n=6/6). Arrows point to calvarial fragmentations in the RA-treated, non-ablated transgenic, and corresponding regions of the other specimens lacking fragmentation. (K) Comparative qRT-PCR analysis of isolated calvarial plates from SL11-12 sibling fish containing (MTZ) or lacking (+MTZ) osteogenic cells, and treated (RA) or not treated (DMSO) with RA. Columns with same superscript letter (a,b,c) are not significantly different (P>0.05). In the absence of osteogenic cells (MTZ+RA), RA fails to significantly induce expression of phex and rankl (MTZ+RA versus MTZ+DMSO), whereas spp1 is much more weakly induced (1.8× in MTZ+RA versus MTZ+DMSO, compared with 6.6× in RA versus DMSO). The remaining spp1 induction most likely reflects expression in other cell types (compare with Fig. 6 F and see Discussion). Furthermore, RA-treated fish containing osteogenic cells (RA) display 5.5-fold higher expression levels of the direct osteoclastogenesis effector rankl compared with RA-treated fish lacking osteogenic cells (MTZ+RA). mc, melanocytes. |

RA induces premature osteoblast-to-preosteocyte transitioning at calvarial fragmentation sites. A,B,G-N show sagittal, and C-F show transverse sections through the fragmentation sites above the epiphyseal bar (eb; outlined) of the frontal plate of SL9-10 wild-type fish treated as indicated. (A,B) The number of osx-expressing cells, as assessed in tg(osx:NTR-mCherry), is unaltered upon RA treatment (9.0±1.26 cells in defined area above epiphyseal bar in DMSO control versus 9.2±1.06 cells in corresponding region of RA-treated fish; n=12 confocal stacks from three independent specimen for each condition). In B, the space separating the two osx-positive lines is strongly reduced, reflecting the thinning or complete loss of the calvarial plate. (C,D) In situ hybridizations, revealing strongly impaired expression of the collagen gene col1a1 in bone-lining cells of the RA-treated fish. (E,F) Expression of bglap, a marker for mature osteoblasts, as assessed in tg(bglap:GFP), is downregulated in RA-treated sample. (G-J) In situ hybridizations, revealing increased expression of spp1 (G,H) and the preosteocyte marker phex (I,J) in bone-lining cells of the RA-treated fish. (K-M) phex in situ hybridization (K,L; green), counterstained via anti-RFP immunolabeling of osteogenic cells expressing the osx:NTRmCherry transgene (red; merged images in M,N). phex induction by RA is most prominent in osteogenic cells above the epiphyseal bar. |

In mutants lacking osteoclasts, preosteocytes are normally induced, whereas osteoclast markers cannot be induced after ablation of osteogenic cells. (A,B) Fluorescent phex in situ hybridization of RA-treated pfe mutants at osteogenic front (A; of) and calvarial fragmentation site (B), counterstained with DAPI (white). pfe mutants display a similar phex expression pattern as RA-treated wild-type controls (Figs 2R vs 5L). (C) qRT-PCR analysis of osteoblast marker genes in pfe mutants and wild-type controls after DMSO or RA treatment. The preosteocyte markers phex and rankl are induced by RA in pfe-/- mutants to a similar extent as in wild-type controls; spp1 induction is even stronger than in wild-type controls (9.5× versus 5.3×), pointing to an inhibitory role of osteoclasts on Spp1 production in preosteocytes (Sims and Martin, 2014). (D,E) In the absence of osteogenic cells, RA fails to induce osteoclastic acp5a expression in epiphyseal bar region (E), in contrast to controls containing osteogenic cells (D). (F) qRT-PCR analysis of osteoclastic marker gene expression. In the absence of osteogenic cells, RA induces a down-, rather than an upregulation of the osteoclast-specific marker gene acp5a, whereas rank levels, which are 1.56±0.13× increased upon RA treatment of wild-type controls, do not respond to RA. By contrast, ctsk expression is induced (1.2±0.02×), but induction is weaker than in controls (2.2±0.09×). The remaining ctsk and spp1 (Fig. 4K) induction is most likely due to their activation in other cell types such as macrophages, consistent with former reports (Bühling et al., 2001; Rittling, 2011). **P<0.01, ***P<0.001, ****P<0.0001, ns, not significant. |

Osteoclasts are tightly associated with preosteocytes and, in contrast to osteogenic cells, lack cyp26b1 expression. All images show wild-type specimens at 7dpt with RA. DMSO-treated controls stained in parallel lacked detectable spp1, acp5a and cyp26b1 signals (not shown). A-F,I-L show sagittal sections through sites of calvarial fragmentation; G,H show transverse sections at the osteogenic front region of a frontal plate, labeled by in situ hybridization with the indicated probes and/or anti-RFP immunolabeling of osteogenic cells expressing tg(osx:NTRmCherry). Osteoclasts are labeled with asterisks, preosteocytes with filled arrowheads, and other osteogenic cells with open arrowheads. (A-C) spp1 is expressed in an osx+ cell (preosteocyte), which is tightly associated with an spp1+, osx cell (osteoclast) (n=8/8). Note that particularly on the outer surface of the calvarial plate, not all osx+ cells express spp1. (D-F) ssp1 is expressed in an acp5a+ osteoclast, which is tightly associated with an ssp1+, acp5a cell (preosteocyte) (n=13/13). (G,H) At the osteogenic front, almost all osx+ osteogenic cells lining the growing calvarial plate display RA-induced cyp26b1 expression (n=5/5). (I,J) Sites of calvarial fragmentation contain both cyp26b1+ and cyp26b1 osteogenic cells (osx+). Note that chondrocytes in the epiphyseal bar lack RA-induced cyp26b1 expression (n=5/5). (K,L) acp5a+ osteoclasts lack cyp26b1 expression (n=8/8). Panels G-J show additional cyp26b1 expression in dermal fibroblasts, known targets of RA signaling (Nelson and Balian, 1984; Varani et al., 1990). Panels I-L show additional and very strong RA-induced cyp26b1 expression in a distinct tissue adjacent to the epiphyseal bar. The exact nature of this tissue is unknown. It contains multiple blood vessels, not seen in such sizes and densities in other subcalvarial regions (compare with Fig. S5A). bv, blood vessel; cp, calvarial plate; df, dermal fibrobasts; eb, epiphyseal bar; of, osteogenic front. |

RA-induced ectopic intercalvarial ossification predominantly occurs in the overlying dermis, consistent with the cutaneous col1a2 expression. (A,B) SL8-9 fish treated with DMSO (A) or RA (B) for 7 days, after consecutive in vivo AR staining (red) before and calcein staining (green) after the treatment, as shown in Fig. 1D,E; virtual transverse sections obtained from 3D projections along confocal Z-stacks (ZEN2008 software; Zeiss) at positions indicated by arrowheads in Fig. 1D,E. The weak calcein staining between the frontal calvaria of the RA-treated fish (Fig. 1E; asterisk) predominantly occurs in regions slightly dorsal of the calvarial plates (indicated in (B) with arrowhead). According to H&E and Azan novum stainings (see for instance Fig. S5A), this is the dermis. (C,D) in situ hybridizations of untreated SL10 fish for col1a1 (C) and col1a2 (D). In contrast to col1a1, whose expression is restricted to bone-lining osteoblasts (C; compare with Figs. 2F and 5C), col1a2 is expressed by basal keratinocytes (bf), dermal fibroblasts (df), consistent with former reports (Le Guellec and Sire, 2004), and in connective tissue fibroblasts (fb) between and below the calvarial plates. Upon RA-treatment, this col1a2 expression became slightly reduced (data not shown). However, the reduction was much more moderate than that of col1a1 in osteoblasts (see Figs. 2F,G and 5C,D). Abbreviations: bk, basal keratinocytes; df, dermal fibroblasts; fb, fibroblasts; fp, frontal calvarial plates |
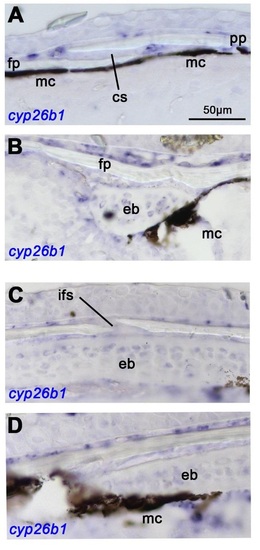
cyp26b1 displays differential expression in bone-lining cells of the calvarial plates. Panels (A,B) show sagittal sections, panels (C,D) transverse sections of untreated wild-type fish at SL10; cyp26b1 in situ hybridization, revealing weak and differential cyp26b1 expression in bone-lining cells. At the level of the sutures, where plates continue to grow (A,C), cyp26b1 is more weakly expressed than in central regions of the plate (B,D), where no horizontal growth occurs. Within central regions, cyp261 is expressed more strongly on the outer surface of the calvaria than on their inner surface (B,D), complementary to the asymmetric vertical growth of the calvaria, which preferentially occurs on their inner surface (see Fig. 1G). In conclusion, cyp26b1 is preferentially expressed in bone-lining cells of regions that display no or reduced bony growth. Abbreviations: cs, coronal suture; eb, epiphyseal bar; fp, frontal plate; ifs, interfrontal suture; mc, melanocyte; pp, parietal plate. |

aldh1a2 displays differential expression in the meninges underlying the calvarial plates. Panels (A,B,G) show transverse sections, panels (C-F) sagittal sections of untreated fish at SL9 (A,B) or SL10-11 (C-G). (A,B) aldh1a2 in situ hybridization; aldh1a2 signals are marked with arrows; melanocytes of the meninges (mc) (Goldgeier et al., 1984) and the calvarial plate (cp) are indicated. Note that the aldh1a2+ cells are positioned between or even underneath the meningeal melanocytes. (C-G) Double immunofluorescence for tg(aldh1a2:aldh1a2-GFP)-driven GFP (Pittlik and Begemann, 2012) and the osteogenic cell marker ZNS5, counterstained with DAPI. Panel (C) shows an overview, and panels (D-F) magnified views of regions indicated in (C); panel (G) shows transverse sections at the level within the region shown in (F). (F,G) are directly at the osteogenic fronts (of) of the frontal (fp) and parietal plates (pp), which have not met and formed a suture as yet; (D) is at the level of the epiphyseal bar (eb), thus, within central regions of the frontal plate and very remote from the osteogenic front, and (E) is in an intermediate position closer to the frontal pate osteogenic front. In (D), the distinct and highly vascularized tissue directly anterior of the epiphyseal bar, which displays strong RA-induced cyp26b1 expression (Fig. 7I-L), is outlined. The Aldh1a2-GFP signal is much stronger in regions close to the osteogenic front than in very remote regions. In addition, it is not localized within the ZNS5-positive osteogenic cells themselves, but in cells below them, at about the same level like the meningeal melanocytes. This expression pattern correlates with the pattern of calvarial growth, with horizontal growth occurring at the osteogenic fronts (see Fig. 1D), and vertical growth preferentially occurring on the inner surface of the calvarial plates (see Fig. 1G). Abbreviations: bv, blood vessel; cp, calvarial plate; eb, epiphyseal bar; ep, epidermis; ey, eye: fp, frontal plate; mc, melanocytes; of, osteogenic front; pp, parietal plate, tc, optic tectum. |

osx:NTRmCherry-encoded protein is expressed in osteogenic cells of all differentiation stages. (A,B) Double fluorescence of tg(osx:NTRmCherry) (red; upper row) together with tg(runx2:EGFP), marking osteoblast progenitors (Kague et al., 2012) (A) or with tg(bglap:GFP) (Vanoevelen et al., 2011) (B), marking mature osteoblasts (green, middle row); counterstained with DAPI (white); transverse sections through frontal plate. Osteogenic front (of) is indicated. Yellow arrowheads in the merged images (lower row) point to osx+runx2 double positive close to the osteogenic front (A), and to osx+bglap double positive bone-lining cells more remote from the osteogenic front (B). (C) Double immunofluorescence for tg(osx:NTRmCherry)-driven RFP and the osteogenic cell marker ZNS5; transverse section through the orbital bone of SL22 wild-type fish: in addition to its co-expression with ZNS5 in bone-lining cells, the osx transgene is expressed in isolated cells within the mineralized bone, which most likely are terminally differentiated osteocytes (Franz-Odendaal et al., 2006). |

RA-induced calvarial fragmentation occurs primarily at the level of the epiphyseal bar. (A) Azan novum staining of sagittal section through head of 1 year old untreated fish; anterior to the left; region of epiphyseal bar. Directly anterior of the epiphyseal bar is a distinct tissue that is tightly associated with the calvarial plate, suggesting that it is extracephalic. It is highly vascularized, and was not found at any other position along the anterior-posterior length of the brain case. Compare also with Fig. S3D and with Fig. 7I-L, showing that this tissue displays strong cyp26b1 expression upon RA treatment. (B) tg(col1a1:GFP) fish (Kague et al., 2012) after RA-treatment and in vivo alizarin red staining; dorsal view on head region. The holes directly above the GFP-positive epiphyseal bar are indicated with arrows. (C,D) Sagittal sections through epiphyseal bar region of fish after treatment with 1µM DMSO (B) or 1µM RA (C); H&E staining; in (D) the borders of the calvarial hole are indicated with arrows. (E,F) Magnified views of images shown in Figure 3P,Q; transverse sections through epiphyseal bar region of wild-type sibling (D) and sst mutant (E); TRAP staining; the interfrontal suture (ifs) is indicated with an arrow, the thickness of the calvarial plate with a bar. Abbreviations: bv, blood vessel; df, dermal fibroblast; eb, epiphyseal bar; ep, epidermis; fp, frontal plate; ifs, interfrontal suture. |

Metronidazole treatment of tg(osx:NTRmcherry) transgenics leads to efficient osteogenic cell ablation and impaired bone formation. (A) Red channel of images shown in Fig. 4G,J, with dorsal views an calvarial plates of osx:NTRmcherry transgenic fish after treatment with DMSO (left panel) or MTZ (right panel), revealing ablation of approximately 95% of all osx transgenic / osteogenic cells. (B) qRT-PCR analysis of isolated calvarial plates from SL11-12 tg(osx:NTRmcherry) fish. Expression of osteoblast marker genes bglap, col10a1 and col1a1 is strongly reduced after osteogenic cell ablation / MTZ-treatment, compared to the DMSO-treated controls. (C,D) in situ hybridization, revealing loss of col1a1 expression along calvarial plates after treatment with DMSO and MTZ (D), compared to DMSO treatment alone (D). (E,F) Magnified dorsal view of central head region of SL9-10 non-transgenic sibling control fish treated with DMSO (E-E′′; n=5/5), and tg(osx:NTRmcherry) transgenic treated with DMSO + MTZ (F-F′′; n=6/6) for 7 days, after consecutive in vivo alizarin red staining (red; E,F) before and calcein staining (green; E′,F′) after the treatment. Panels (E′′,F′′) show merged images. After osteogenic cell ablation, growth at the osteogenic fronts of the frontal calvarial plates ceases completely (compare with Fig. 1D-F for the strongly reduced, but not completely ceased calvarial growth upon RA-treatment of wild-type fish). |