
- Title
-
Evx1 and Evx2 specify excitatory neurotransmitter fates and suppress inhibitory fates through a Pax2-independent mechanism
- Authors
- Juárez-Morales, J.L., Schulte, C.J., Pezoa, S.A., Vallejo, G.K., Hilinski, W.C., England, S.J., de Jager, S., Lewis, K.E.
- Source
- Full text @ Neural Dev.

V0v cells co-express evx1 and evx2. a Schematic of Evx2 showing exon boundaries (dotted lines), homeobox-domain (pink) and location of evx2 sa140 mutation (red arrow). b Examples of genotyping WT, heterozygous and homozygous evx2 sa140 mutant embryos using gel electrophoresis (see methods). The two fragments from the mutant allele restriction product run at the same position on the gel. c, e-h lateral views, dorsal up, anterior left, of spinal cord at 24 h (f-h) or 27 h (c & e). c Evx2 immunohistochemistry on WT (top panel) and homozygous evx2 sa140 mutant (bottom panel) embryos. Stars indicate Evx2-expressing cells. Mutant embryos have no Evx2 expression. d Schematic showing Shuffle-LAGAN analysis of evx1 genomic region with zebrafish sequence as baseline compared to orthologous regions in mouse and human genomes. Conserved coding sequences are indicated in blue, arrow indicates 5'-3' orientation. CNEs in 3’ region are indicated in pink. The region amplified to create transgenic lines is indicated with red dotted lines. e-h Double staining for (e) EGFP (green) and Evx2 (red) in Tg(evx1:EGFP) SU1 embryos, (f) EGFP (green) and evx1 (red) in Tg(evx1:EGFP) SU1 embryos, (g) evx1 (red) and evx2 (green) in WT embryos, (h) EGFP (green) and dbx1a (red) in Tg(evx1:EGFP) SU1 embryos (i and iii) and EGFP (green) and dbx1b (red) in Tg(evx1:EGFP) SU1 embryos (ii and iv). In e-g and h_iii - h_iv, merged and single channel views are provided. White crosses indicate cells that only express evx1. In (f) these probably represent cells that have just started to express evx1 as there is a delay in expression of EGFP. White stars in h indicate double-labelled cells. Three wider panels at bottom of h (iii and iv) are magnified single-confocal-plane views of white dotted rectangle regions in panels h_i and h_ii respectively. Thin panel on RHS in each case shows a cross-section projection (slice) created in Image J confirming that GFP expression is lateral to dbx expression. Scale bar: 50 μm (c & e-h) |
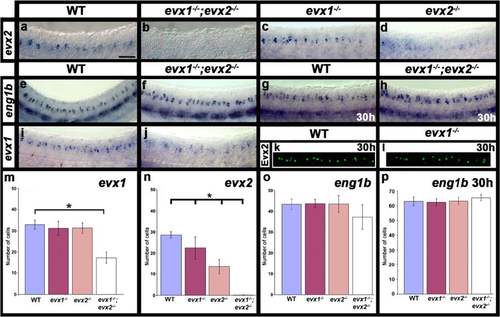
Expression of evx and eng1b genes in evx1;evx2 double mutant embryos. Lateral views of zebrafish spinal cord at 24 h (a-f, i & j) or 30 h (g, h, k & l ). Anterior left, dorsal up. a-j in situ hybridization for each gene indicated. e-h strong ventral expression is in muscle pioneer cells, expression in more individual dorsal cells corresponds to spinal cord V1 cells. k & l immunohistochemistry for Evx2. m-p Average number of cells (y-axis) expressing indicated marker in spinal cord region adjacent to somites 6-10 in WT embryos and evx1 and evx2 single and double mutants (x-axis) at 24 h (m-o) or 30 h (p). Values are shown as mean +/- standard deviation (values are provided in Table 1). There are no evx2-positive cells in the double mutants (n). In each case at least 5 embryos were counted, except for eng1b where 4 embryos were counted. Statistically significant differences (P < 0.05) from WT values are indicated with brackets and stars. P values for these and other comparisons (e.g differences between single and double mutants) are provided in Table 1. Scale bar: 50 μm (a-l) |
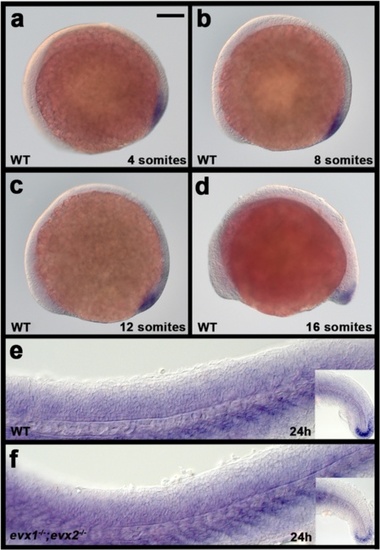
eve1 is not expressed in zebrafish spinal cord in WT or evx1;evx2 double mutant embryos. Lateral views of in situ hybridization for eve1 in 4-somite (a), 8-somite (b), 12-somite (c), 16-somite (d) and 24 h (e & f) embryos. a-e WT; (f) evx1;evx2 double mutant. Anterior is left and dorsal up. Expression is seen in the tail bud region but not the spinal cord. Embryos in (e & f) were over-stained to check that there was no weak expression in the spinal cord. The only specific staining seen was at the end of the tail (inset in right bottom corner). The rest is background staining from over-staining. Scale bar: 100 μm EXPRESSION / LABELING:
|
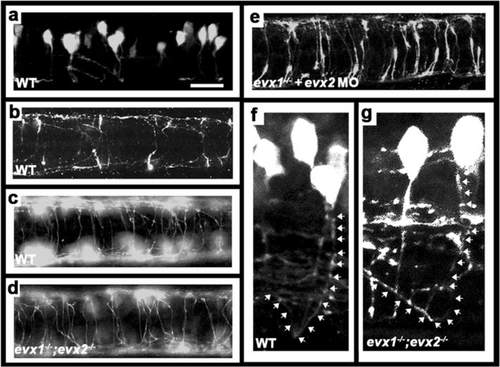
V0v cells develop into CoSA interneurons. Immunohistochemistry for EGFP in Tg(evx1:EGFP) SU1 (a, b & e) or Tg(evx1:EGFP) SU2 (c, d, f & g) embryos. . a, f & g lateral views with dorsal up and anterior left of spinal cord at 27 h (a) or 48 h (f & g). b-e dorsal views with anterior left of zebrafish spinal cord at 30 h (b) or 48 h (c-e). a-c & f WT, (d & g) evx1;evx2 double mutant, (e) evx1 mutant injected with evx2 morpholino. b & c show increasing number of commissural axons crossing the spinal cord as development proceeds. d & e demonstrate that V0v axons are still clearly commissural in the absence of Evx1 and Evx2. f & g show magnified views of commissural ascending V0v axons. White arrows (drawn slightly to the right of the axon so that EGFP expression is still visible) indicate ascending axon trajectories. Scale bar: 50 μm (a-e) and 15 μm (f & g) |
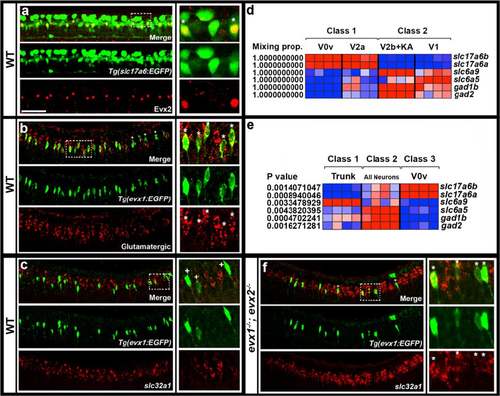
Neurotransmitter phenotypes of V0v cells. Lateral views of spinal cord at 27 h (a & b) or 30 h (c & f). All panels contain merged and single channel views. Smaller images on RHS are single confocal planes of white box regions. Double and single-labeled EGFP-positive cells are indicated in single confocal planes with stars and crosses respectively. a EGFP (green) and Evx2 (red) expression in Tg(slc17a6:EGFP) embryo. All Evx2-positive cells co-express EGFP. b EGFP (green) and glutamatergic marker (slc17a6b & slc17a6a; red) expression in Tg(evx1:EGFP) SU1 embryo. Occasional single-positive cells are indicated with crosses. These may be expressing glutamatergic markers at levels too low to detect (slc17a6 probes are weak in double-labeling experiments). Remaining cells are double-labeled. c & f EGFP (green) and slc32a1 (red) expression in Tg(evx1:EGFP) SU2 WT (c) and evx1;evx2 double mutant (f) embryos. No V0v cells are inhibitory in WT embryos, but most V0v cells are inhibitory in double mutants (occasional single-labeled cells are indicated with a cross in F). (d & e) Relative expression profiles of genes (names on right) indicative of neurotransmitter fates at 27 h. Columns represent individual microarray experiments. Rows indicate relative expression levels as normalized data transformed to mean of zero and standard deviation of +1 (highly-expressed, red) to -1 (weakly/not expressed, blue) sigma units. For details of how cells were isolated see methods. d Two-class eBayes comparison of excitatory (class 1) versus inhibitory (class 2) cells. Mixing proportion measures posterior probability, or likelihood that genes are differentially expressed (1 = highest probability of differential expression). e Three-class ANOVA comparison of V0v cells (class 3) versus trunk cells (class 1) and all post-mitotic neurons (class 2). P values test hypothesis that there is no differential expression between the 3 classes. V0v cells express glutamatergic markers slc17a6a and slc17a6b and do not express glycinergic or GABAergic markers in both comparisons. Scale bar: 50 μm (a-c & f) |
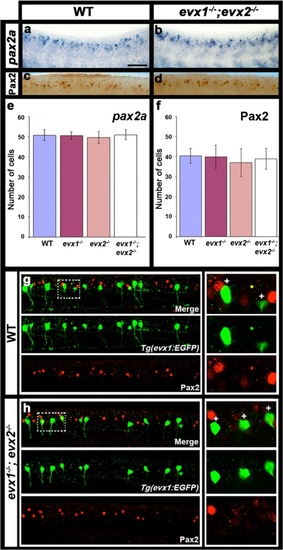
V0v cells do not express Pax2 in WT or evx1;evx2 double mutant embryos. Lateral views of zebrafish spinal cord at 24 h (a-d) or 30 h (g & h). Anterior left, dorsal up. a & b in situ hybridization for pax2a. c & d immunohistochemistry for Pax2. The Pax2 antibody recognizes both Pax2a and Pax2b. e & f Average number of cells (y-axis) expressing these markers (indicated in each case) in spinal cord region adjacent to somites 6-10 in WT embryos and evx1 and evx2 single and double mutants (x-axis). Values are shown as mean +/- standard deviation (values are provided in Table 1). In each case at least 5 embryos were counted, except for pax2a where 4 embryos were counted. P values for all comparisons are provided in Table 1. g & h EGFP (green) and Pax2 (red) expression in Tg(evx1:EGFP) SU2 WT (g) and evx1;evx2 double mutant (h) embryos. No V0v cells express Pax2 in either case. Panels on RHS are magnified single-confocal-plane views of white dotted rectangle regions in panels G and H respectively. White crosses indicate single-positive GFP cells. Scale bar: 50 μm (a-d) & 40 μm (g-h) |

skor2 is expressed by V0v cells and this expression is lost in evx1;evx2 double mutants. Lateral views of zebrafish spinal cord at 27 h (a) and 30 h (b-d). Anterior left, dorsal top. a & b Merged images on top followed by single-channel views. Panels on RHS are single confocal planes of white dashed-box regions. Stars indicate double-positive cells. a Expression of skor2 (red) and EGFP (green) in Tg(evx1:EGFP) SU1 embryo. In this example, all ventral skor2-expressing cells co-express EGFP. On average, 97 % of ventral skor2-expressing cells co-express EGFP (73/75 cells counted in 4 embryos). In contrast, about 57.5 % of V0v cells co-express skor2 (73/127 cells counted in 4 embryos). b Expression of skor2 (red) and EGFP (green) in Tg(slc17a6:EGFP) embryo that labels glutamatergic cells. Crosses indicate cells that are only clearly positive for skor2. On average 93.5 % of skor2-expressing cells co-express EGFP (201/215 cells counted in 4 embryos). As there is usually a delay in EGFP expression it is possible that all ventral skor2-expressing cells are excitatory V0v cells, as the small number of ventral skor2-positive EGFP-negative cells may be just starting to express EGFP. c & d Expression of skor2 (blue) in both WT (c) and evx1;evx2 double mutant (d) embryos. The ventral row of skor2 expression is lost in double mutants. e Average number of cells (y-axis) expressing skor2 in spinal cord region adjacent to somites 6-10 in WT embryos and evx1 and evx2 single and double mutants (x-axis) at 30 h. Results are shown for the ventral (V0v) domain of skor2 expression and for the whole skor2 expression domain (total cell counts). Values are mean +/- standard deviation (also see Table 1). In each case at least 5 embryos were counted. Statistically significant differences (P < 0.05) from WT values are indicated with stars. P values for all comparisons are provided in Table 1. Scale bar: 50 μm (a & b); 40 μm (c & d) |
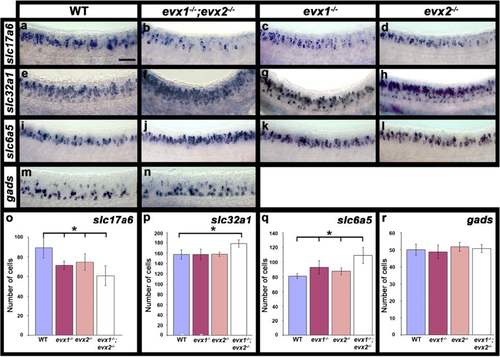
Neurotransmitter phenotypes in evx1;evx2 double mutant embryos. Lateral views of zebrafish spinal cord at 24 h (a-n). Anterior is left, dorsal up. in situ hybridization for gene or genes indicated. slc17a6 (a-d) corresponds to a mix of slc17a6b and slc17a6a probes that label glutamatergic cells; slc32a1 (e-h, formerly called viaat) labels all inhibitory cells; slc6a5 (i-l) labels glycinergic cells and gads (m & n) corresponds to a mix of gad1a and gad2 probes that labels GABAergic cells (see methods for more details). o-r Average number of cells (y-axis) expressing these markers (indicated in each case) in spinal cord region adjacent to somites 6-10 in WT embryos and evx1 and evx2 single and double mutants (x-axis) at 24 h. Values are shown as mean +/- standard deviation (values are provided in Table 1). In each case at least 5 embryos were counted. Statistically significant differences (P < 0.05) from WT values are indicated with brackets and stars. P values for all comparisons are provided in Table 1. Scale bar: 50 μm (a-n) |