
- Title
-
Comparative transcriptomic profiling of hydrogen peroxide signaling networks in zebrafish and human keratinocytes: Implications toward conservation, migration and wound healing
- Authors
- Lisse, T.S., King, B.L., Rieger, S.
- Source
- Full text @ Sci. Rep.

Whole transcriptome RNA-seq profile of larval zebrafish in response to low H2O2 treatment.,/p> (a) Pools of ~500 larvae/set of 4 day-post-fertilized (dpf) zebrafish larvae were treated with 0.01% (3 mM) H2O2 for three hours and total RNA was subsequently collected followed by pair-end next generation RNA sequencing (n = 3 biological replicates). (b) H2O2 sensor (HPF) either alone or with H2O2 treatment shows that H2O2 is mostly retained in the skin epithelium (n = 5 fish). (c) Distribution of mapped reads in the zebrafish transcriptome. RNA-seq data sent to NCBI (GEO: GSE75728). (d) Transcript complexity between untreated and H2O2-treated larval zebrafish samples. Based on read CPM (counts per million), the left-most value on the X-axis represents the most highly expressed transcripts, which is incrementally summed with each successively lower expressed transcript (rightward). The y-axis (% contribution of the total transcripts) was calculated using: [CPM/sum of all CPM] x 100%. (e) RNA-seq data was normalized with the read CPM method of the number of mapped reads on gene exons. Transcript expression data transformed on M (log ratio of fold change) and A (mean average) scale. Boxed blue regions represent statistically significant transcripts (p < 0.05) returned by the test for differential expression. The MA-plot shows the log2 fold changes from the treatment over the mean of normalized counts, i.e. the average of counts normalized by size factor. Cutoff set to >1 log2 CPM averaged over all samples, and below the cutoff there is no real inferential power. Note: Statistical significance drops below the threshold. (f) Quantitative PCR validation of RNA-seq results of a sub-set of candidate targets. Full data set is presented in Table S7 (n = 3 biological replicates). (g) Heat map indicates unsupervised hierarchical clustering of the top (left) and bottom (right) most significantly enriched transcripts derived from the RNA-seq data after H2O2 treatment. Hierarchical clustering was performed between individual experiments and transcripts. The color key indicates the log2 CPM expression values. Abbreviations: HPF (hydrogen peroxide fluorogenic probe or pentafluorobenzenesulfonyl-fluorescein), CPM: Counts per million, FC: Fold-change. |
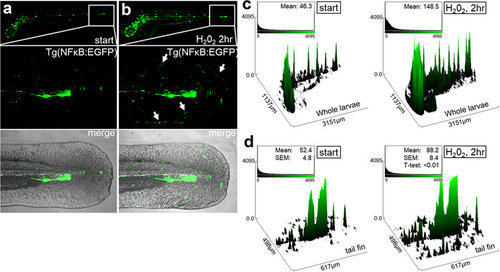
Transgenic NF-κB:EGFP zebrafish reveal peripheral NF-κB activation after H2O2 treatment Spatial patterns of increased NF-κB activation after H2O2 treatment of zebrafish larvae. (a) 3-dpf Tg(NF-κB:EGFP) reporter zebrafish larvae at the start of the experiment. (b) Tg(NF-κB:EGFP) zebrafish were imaged after 2hr post 0.01% H2O2 treatment. Both whole larvae (upper) and tail fins (below) were imaged, whereby GFP+ cells were partially localized to the periphery (arrows). (c) Quantitative analysis using relative mean fluorescence of the z-stack projected images using ImageJ (n = 2, 10 fish). Observation of increased number of GFP-labeled cells and overall fluorescence intensity in the whole larvae. (d) Higher-resolution analyses of the tail fin revealed a peripheral tissue spatial pattern of increase NF-κB activated cells after H2O2 treatment. n = 3 independent experiments per condition. EXPRESSION / LABELING:
PHENOTYPE:
|
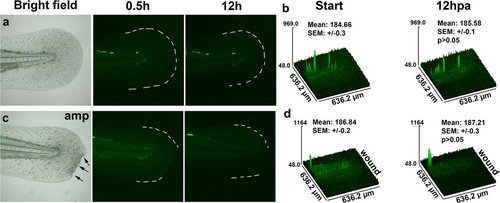
Comparison of ARE/EPRE:GFP activation in zebrafish. (a) The caudal fin of an uninjured EPRE:GFP larval zebrafish was imaged over the course of 12 hours. First and last images of the time-lapse sequence are shown. (b) Matching surface plots and quantification, comparing the fluorescence means of 4 individual fish (n = 4). Statistical significance was tested between first and last time points, showing lack of EPRE:GFP activation by 12 hours. (c) First and last image of a time-lapse sequence showing the amputated caudal fin (arrows) of an EPRE:GFP larval zebrafish. (d) Matching surface plots and quantification, comparing the fluorescence means of 6 individual fish, show that injury fails to activate EPRE:GFP. |
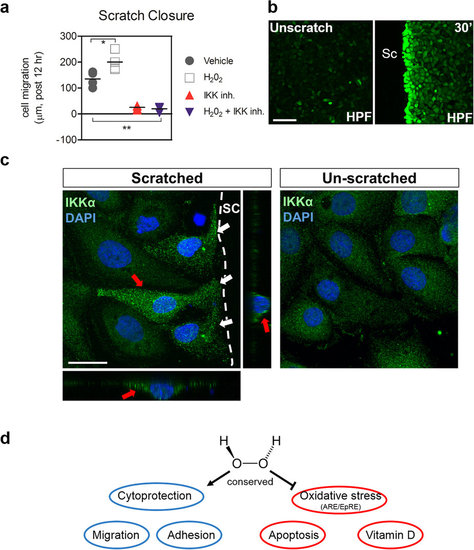
(a) IKK is necessary for H2O2-induced HEK01 keratinocyte migration after wounding. Scratch assays were performed with H2O2 (0.1 µM) and Wedelolactone (50 µM) using HEK01 cells. Two-way ANOVA at an alpha = 0.05 (95% confidence interval) and Bonferroni’s multiple comparison post-tests were utilized. Significance is denoted with asterisks: *p < 0.05, **p < 0.01 (n ≥ 3-5 cell culture experiments). (b) Rapid H2O2 production using 1 µM HPF (hydrogen peroxide fluorogenic probe) at the scratch (sc) margin of HEK01 keratinocytes within 30 minutes. Bar = 100 µm (c) Rapid subcellular accumulation of IKKα within injured HEK01 cells at the scratch (sc) margin (white arrows) after 30 minutes compared to unscratched cells. Orthogonal views (red arrows) of an injured cell show peri-nuclear and cytoplasmic distribution and accumulation of IKKα. Bar = 20 µm. (d) Schema of overall findings. |