
- Title
-
Presynaptic partner selection during retinal circuit reassembly varies with timing of neuronal regeneration in vivo
- Authors
- Yoshimatsu, T., D'Orazi, F.D., Gamlin, C.R., Suzuki, S.C., Suli, A., Kimelman, D., Raible, D.W., Wong, R.O.
- Source
- Full text @ Nat. Commun.

Ultraviolet-cone ablation triggers cone regeneration. (a) Hemisected retina before (at 5 days post fertilization, d.p.f.) and after 1–5 days post ablation (p.d.a.). Ultraviolet cones (magenta) were visualized in Tg(sws1:nfsB-mCherry). BrdU (green) was applied for 1 day at various time points after ablation. The hemisected eyes were stained for phalloidin (blue) to mark in the inner and outer synaptic layers. Arrowheads indicate boundary between original ablated area and the region where ultraviolet cones were added subsequently due to continual retinal growth. (b) Whole-mount retina from Tg(sws1:nfsB-mCherry, sws2:GFP) fish fixed at indicated time points, showing en face view of ultraviolet (magenta) and blue (cyan) cones before and after ultraviolet-cone ablation and regeneration. Arrowheads point to the location of the optic nerve head (ONH). (c) Cone densities before and after ultraviolet-cone ablation, and from age-matched control animals. Large circles are the mean values and small circles indicate values from each retina. Error bars are s.e.m. Red and green cones (R/G) were visualized by immunostaining with the zpr1 antibody. NS, not significant (P=0.94). P values are from Mann–Whitney rank-sum test. UV, ultraviolet. |
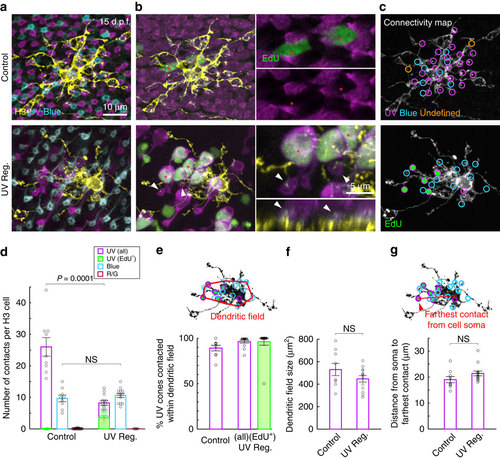
H3 HCs rewire selectively with new ultraviolet cones. (a) H3 HCs (yellow) in age-matched control and ultraviolet regenerated (UV Reg.) retinae at 15 d.p.f. visualized by one-cell stage DNA plasmid injection in the background of Tg(sws1:nfsB-mCherry, sws2:GFP) retina. Only the pedicles of the cones are shown here. (b) EdU (green) does not label ultraviolet cones in control retina (red asterisks), whereas many ultraviolet cones (red asterisks) are EdU positive after a period of regeneration (UV Reg.). The cell bodies and axon pedicles of the ultraviolet cones are shown. In the UV Reg. retina, orthogonal view of the H3 HC reveal dendritic tips inserting into EdU-positive regenerated ultraviolet cones (arrowheads). (c) Circles indicate the location of dendritic tips contacting each cone type. Green-filled circles are EdU-positive cones. Dendritic tips not associated with either ultraviolet and blue cones are assigned as undefined. (d-g). Quantitation of population data. (e) The dendritic field is defined as a polygon connecting the outermost dendritic tips. (g) Distance from the centre of mass of the cell soma to the farthest dendritic tip is quantified here. For all cells measured, the farthest contact was with an ultraviolet cone. For all plots, circles indicate values from individual cells. Error bars are s.e.m. NS, not significant; (d) P=0.42, (f) P=0.35, (g) P=0.12. P values are from Mann–Whitney rank-sum test. UV, ultraviolet. |

H3 HCs do not elaborate dendrites to contact more blue cones before ultraviolet-cone regeneration. (a) Two-photon time-lapse imaging of an H3 HC (grey scale or yellow cell) in the background of Tg(sws1:nfsB-CFP, sws1:nfsB-mCherry, sws2:mCherry) before and during ultraviolet-cone regeneration. d.p.a., days post ablation. Cyan arrowheads point to a dendritic tip invaginating a blue-cone axon pedicle that was maintained throughout the time course of imaging. Magenta arrowheads indicate a dendritic tip that retracted after ultraviolet-cone ablation. New dendritic tips elaborated to contact regenerated ultraviolet cones (white arrowheads). Undefined (orange circle); dendritic tip not apposed to blue or ultraviolet cone. (b) Addition and elimination of cone contacts across time points before ultraviolet-cone regeneration (n=6 cells each for control and regeneration condition (UV Reg.)). Individual cone contacts were followed at 2-day intervals to identify contact appearance or disappearance. (c) Net change in cone contact numbers of the same set of cells in b, after ultraviolet-cone regeneration. Contacts were visualized in fixed tissue at 10 d.p.a. because pigmentation of the larval retina between 4 and 10 d.p.a. (9-15 d.p.f.) prevented in vivo imaging. (b-c) Circles indicate values from individual H3 HCs. Error bars are s.e.m. NS, not significant (P=0.34). P values are from Mann–Whitney rank-sum test. UV, ultraviolet. |
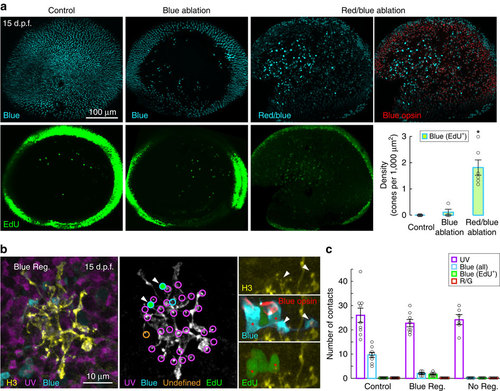
H3 HCs wire with regenerated population of blue cones. From (a) Distribution of blue cones or red and blue cones in the whole-mount retinae at 15 d.p.f. Blue-cone-only ablation (B ablation) was performed using Tg(sws2:nfsB-mCherry), or blue and red cones were ablated (R/B ablation) together using Tg(sws2:nfsB-mCherry, thrb:gal4, clmc:GFP; UAS:nfsB-mCherry). Blue-opsin immunostaining (red) identified blue cones among red and blue cones that both express mCherry. EdU labelling is shown in green. Density of EdU+ blue cones are plotted for all conditions. Circles are values from individual retina. Error bars are s.e.m. *P=0.0022 for pair-wise comparisons with control or R/B ablation. P values are from Mann–Whitney rank-sum test. (b) An H3 HC in a retina with blue-cone regeneration (Blue Reg.) after red and blue-cone ablation at 5 d.p.f. using Tg(sws1:GFP, sws2:nfsB-mCherry, thrb:gal4, clmc:GFP; UAS:nfsB-mCherry) animals. Blue cones were identified by blue-opsin immunostaining (red). Dendritic tips (arrowheads) of the HC invaginated the EdU+ blue cones (red asterisks). (c) Quantification of ultraviolet and blue-cone contacts in retina in which red and blue cones were ablated. H3 HCs located in retinal regions lacking blue-cone regeneration (No Reg.) are grouped separately from H3 HCs that were located in areas containing regenerated blue cones (Blue Reg.). Red/green (R/G) cones identified by zpr1 immunostaining. Circles are values obtained from individual cells. Error bars are s.e.m. UV, ultraviolet. |
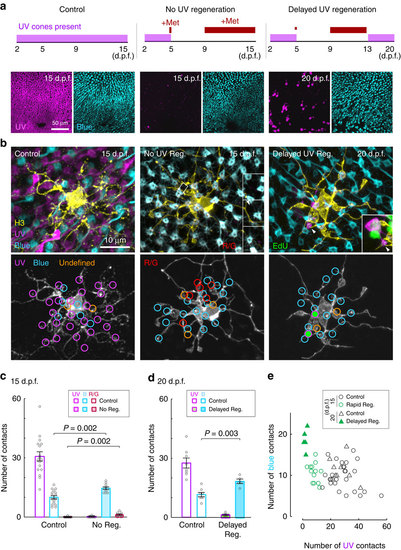
H3 HCs synapse with blue cones and other cone types when ultraviolet cones fail to regenerate. (a) Schematic showing period of metronidazole (Met) treatment (red lines) and ultraviolet-cone presence in the retina (magenta bars). Images show distribution of ultraviolet (magenta) and blue (cyan) cones in the whole-mount retina at the end of the treatments. (b) Examples of an H3 HC in control retina, in a retina with no ultraviolet regeneration (No UV Reg.) and in a retina with delayed regeneration (Delayed UV Reg.). Inset for the no regeneration example shows sideview of a dendritic tip (arrowhead) in the boxed region contacting a zpr1-positive red or green cone (R/G, shown in red). Inset for the delayed regeneration example shows contact with a new (EdU+, green) ultraviolet cone. (c,d) Measurements across H3 HC populations; circles are measurements from individual cells. Error bars are s.e.m. Mann-Whitney rank-sum test. (e) Comparison of the number of ultraviolet- versus blue-cone contacts for individual H3 cells in control and regenerated conditions. UV, ultraviolet. B, blue. |
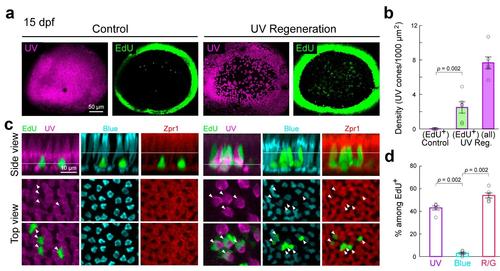
UV cone ablation induces regeneration of specific cone types. (a) Wholemount view of UV cone (magenta) distributions at 15 dpf in a control retina (no ablation) and in a retina after UV cone ablation at 5 dpf Tg(sws1:nfsB-mCherry). EdU (green) was applied to the animals from 1-4 dpa. Dense ring of EdU+ cells mark the ciliary marginal zone where cell genesis persists into adulthood. (b) Densities of EdU+ UV cones at 15 dpf plotted for control retina and retinae with UV cone regeneration (UV Reg.). The density of all UV cones (EdU + or EdU -) present in the UV reg. retina are also plotted. Each circle represents measurements from one retina. (c) (Side view) Orthogonal views of confocal image stacks from control and UV cone ablated retinae showing colabeling for various cone types and EdU (green). zpr1 positive cells (red) are red or green cones. The levels at which UV, blue and red/green cone nuclei stratify are indicated by their respective lines. (Top view) En face view of the cones and EdU labeled nuclei at the levels of the lines marked in the sideviews. Arrowheads point to EdU+ nuclei. (d) Percentage of EdU+ cones that were UV, blue or red/green comprising the regenerated population. |
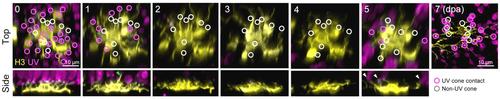
H3 HCs retract dendritic tips as UV cones die, and rewire with the regenerated population of UV cones. Two-photon time-lapse imaging of a H3 HC in the background of Tg(sws1:nfsB-mCherry) beginning at 5 dfp and subsequently after cone ablation and regeneration. Circles indicate the locations of dendritic tips contacting UV cones (magenta) or dendritic tips that were not associated with UV cones (white, non-UV cones). Green arrowhead (1 dpa) points to a dendrite sprouting into the photoreceptor layer. White arrowheads (5 dpa) indicating new dendritic contacts with newly generated UV cones. dpa, days postablation. |

Identification of regenerated blue cones. Blue opsin immunostaining and EdU labeling of Tg(sws2:nfsB-mCherry; thrb:gal4; clmc:GFP; UAS:nfsB-mCherry) retina. Blue opsin signal identifies blue cones among mCherry positive red and blue cones. EdU positive blue cones are outlined by dashed profiles. Asterisks mark EdU positive nuclei. |