
- Title
-
Phenotypic chemical screening using zebrafish neural crest reporters identifies retinoid acid as an inhibitor of epithelial morphogenesis
- Authors
- Jimenez, L., Wang, J., Morrison, M.A., Whatcott, C., Soh, K.K., Warner, S., Bearss, D., Jette, C.A., Stewart, R.A.
- Source
- Full text @ Dis. Model. Mech.
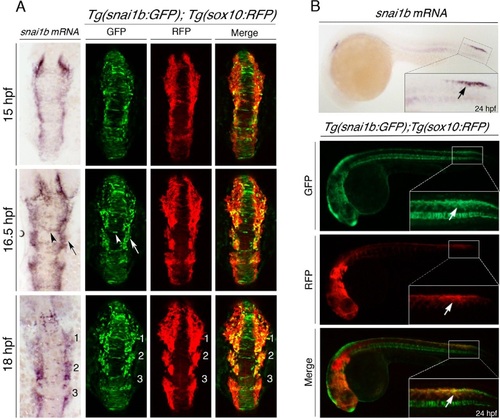
Generating a NC EMT reporter during development. (A) Dorsal views of whole-mount in situ hybridization of snail1b mRNA expression (left) compared to maximal z-projections of double-transgenic Tg(snai1b:GFP); Tg(sox10:RFP) zebrafish embryos (right) at the indicated developmental time points. Tg(snai1b:GFP) expresses GFP in the neuroepithelium (white arrowhead) and neural plate border cells (white arrow), similar to endogenous snail1b mRNA expression (black arrow and arrowhead). Comparison of Tg(snai1b:GFP) with Tg(sox10:RFP) shows that GFP is expressed in both the neuroepithelium and lateral plate border, whereas RFP labels delaminating NC cells at the neural plate border, partially overlapping with GFP (yellow cells). In migrating NC cells, GFP and RFP are co-expressed in the first two cranial streams (numbered). (B) Lateral views of brightfield (top) or epifluorescent (bottom) images of 24-hpf embryos comparing snail1b mRNA in situ hybridization expression in the trunk NC and Tg(snai1b:GFP); Tg(sox10:RFP) embryos, showing that Tg(snai1b:GFP) labels the same region as endogenous snail1b mRNA and co-labels with sox10:RFP in trunk NC cells (white arrows). |

Tg(snai1b:GFP) labels dorsal neural tube progenitors that display morphological cell behaviors of EMT. (A) Transverse hindbrain sections in double-transgenic Tg(snai1b:GFP); Tg(sox10:RFP) embryos at 12, 15 and 18hpf (single confocal z plane, 40×) showing that snai1b-driven GFP is expressed in dorsal neural tube progenitor cells at 15hpf, whereas both GFP and sox10-driven RFP are expressed in cells adjacent to the neural tube and migrating NC cells. (B) Transverse hindbrain sections of Tg(snai1b:GFP) embryos at 17hpf processed for immunofluorescence analysis of Cdh1 (ECAD) and GFP. Bottom row displays higher-magnification views of boxed regions, and show decreased ECAD levels in GFP-positive cells compared to ventral neural tube. Dotted lines in the bottom panel outline the dorsal neural tube. (C) Schematic illustrating the imaging area (top) and cell delamination behavior (bottom left) derived from confocal time-lapse images of Tg(snai1b:GFP); Tg(sox10:RFP) embryos (bottom right), which captured two cells delaminating out of the neuroepithelium to produce sox10-positive NC cells (~14hpf to 18hpf). |
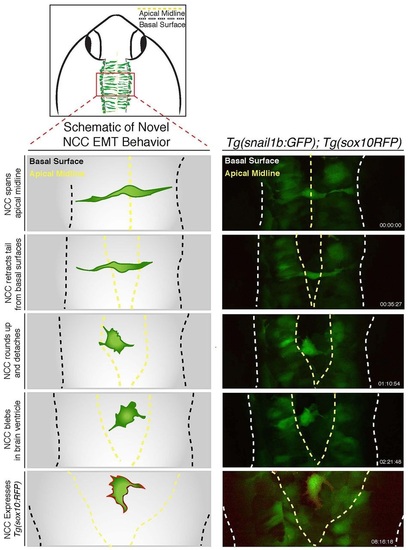
Dorsal midline neural epithelial progenitor cells display novel delamination behaviors of EMT. Schematic illustrating imaging area (top) and novel delamination behavior of a dorsal midline neuroepithelial progenitor (left); the schematic is derived from confocal time-lapse images of Tg(snai1b:GFP); Tg(sox10:RFP) embryos (right). Images show a GFP-positive cell initially spanning the dorsal midline before contracting apical attachments from each side of the neuroepithelium. Subsequently, GFP-positive cells detach and become rounded with filopodia and blebbing protrusions, and ultimately express sox10-mRFP at cell membranes. See also Movie 3. |
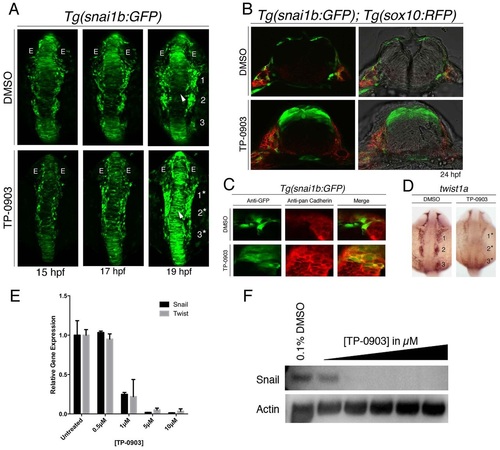
Chemical screening with Tg(snai1b:GFP) identifies TP-0903 as an inhibitor of NC EMT. (A) Dorsal views of Tg(snai1b:GFP) embryos treated with DMSO (top) or TP-0903 (bottom) at 11.5hpf and imaged at the indicated time points by 10× confocal time-lapse microscopy. TP-0903-treated embryos accumulate GFP-positive cells in the dorsal neural tube (arrowhead) and lateral cells remain associated with the neural plate border and are fused (19/20 embryos) (compare numbered streams in DMSO control to numbered asterisks in TP-0903). E, eye. (B) Transverse sections of DMSO (top)- and TP-0903-treated (bottom) Tg(snai1b:GFP); Tg(sox10:RFP) embryos at 24hpf, showing that TP-0903 causes accumulation of GFP-positive cells in the dorsal neural tube (4/5 embryos). (C) Transverse sections through hindbrain of Tg(snai1b:GFP) embryos at 24hpf treated with DMSO (top) or TP-0903 (bottom) and analyzed by immunofluorescence for pan-Cadherin and GFP, showing that GFP-positive cells in TP-0903-treated embryos maintain Cadherin levels and cell-cell adhesion within the neural tube (3/4 embryos). (D) Dorsal views of DMSO (left)- and TP-0903-treated (right) embryos at 18hpf processed for twist1a mRNA in situ hybridization, showing that TP-0903 significantly reduces twist1a expression levels (18/20 embryos) (compare numbered streams in DMSO to numbered asterisks in TP-0903). (E) Analysis of TWIST1 and SNAIL1 mRNA expression in DMSO- and TP-0903-treated PANC-1 cells by RT-qPCR. Two-way ANOVA was used to measure statistical significance. (F) Western blot analysis of PANC-1 cells treated with DMSO or 0.5-10µM TP-0903, showing a dose-dependent decrease in SNAIL1 protein expression. |

TP-0903 acts by inducing retinoic acid signaling in zebrafish embryos. (A) Heat map schematic showing the 50 most differentially expressed transcripts from RNA-Seq as measured by log2 ratio from 4-h-treated DMSO and TP-0903 embryos. Asterisks indicate transcriptional targets of RA examined by whole-mount in situ hybridization in TP-0903-treated embryos. (B) Ingenuity pathway analysis of differentially expressed genes in TP-0903-treated embryos reveals that RA signaling pathways are exclusively activated. Bars represent the P-value for each RA pathway (expressed as 1×log of the P-value). The yellow line represents the ratio of the number of genes from our data set represented within each pathway to the total number of genes in each pathway. (C) Lateral (left panels) and dorsal (right panels) flat-mounted views of in situ hybridization at 16hpf for two genes, cyp26a1 and hoxb1a, identified as elevated by RNA-Seq after 4h TP-0903 treatment. In all panels, krox20 (red) is used as a marker of rhombomeres r3 and r5 (red stain). (D) Lateral (left panels) and dorsal (right panels) flat-mounted views of embryos treated at 13hpf with RA mimic TP-0903 expression effects on cyp26a1 and hoxb1a. |

TP-0903 inhibits expression of dlx2a and induces expression of mitfa in the presumptive ectomesenchymal NC cells. Dorsal views of embryos treated with DMSO or TP-0903 at the 3-somite stage and fixed at the indicated time points for processing by whole-mount in situ hybridization and brightfield microscopy with the indicated probes or direct visualization of pigment cells. (A) Compared to controls (top panel), TP-0903 completely inhibits dlx2a expression in cranial NC streams (18/20 embryos). (B) Analysis of TP-0903-treated embryos with the pan-NC marker crestin shows that NC cells that normally express dlx2a lateral to the neural tube are induced but fail to migrate away, and the first two cranial NC streams are fused together, as indicated by numbered asterisks (13/18 embryos). (C) Analysis of melanophore precursor marker mitfa in control and TP-0903-treated embryos show that TP-0903 induces aberrant mitfa expression in the NC cells lateral to the neural tube (18/20 embryos) (black arrows). (D) Analysis of differentiated melanophores at 48hpf shows that TP-0903 causes accumulation of melanophores on the dorsal neural tube (arrows), but not adjacent to the neural tube (18/21 embryos). |

Retinoic acid controls cranial NC EMT, cell migration and ectomesenchyme differentiation. (A) Dorsal views of maximal z-projection confocal images of Tg(snai1b:GFP); Tg(sox10:RFP) embryos treated with the indicated compounds at 11.5hpf. TP-0903 inhibits NC EMT and cell migration, which is rescued by co-treatment with DEAB (16/18 embryos), an inhibitor of retinaldehyde dehydrogenase (RALDH), which is required for RA biosynthesis. In contrast, direct treatment with RA bypasses the requirement for RALDH and is not rescued by DEAB (0/19 embryos). (B) Transverse sections through the hindbrain of Tg(snai1b); Tg(sox10:RFP) embryos at 24hpf treated with DMSO, TP-0903 or RA confirms that RA treatment causes accumulation of GFP-positive dorsal neural tube cells similar to TP-0903 treatment (6/8 embryos). (C) Dorsal views of 24-hpf embryos processed by whole-mount in situ hybridization for twist1a and dlx2a mRNA, showing that inhibition of RA synthesis in TP-0903-treated embryos rescues expression of these genes in NC streams (numbered) (15/18 and 18/21 embryos, respectively), whereas RA treatment itself mimics TP-0903 and blocks expression of twist1a (14/16 embryos) and dlx2a (18/18 embryos). (D) Dorsal views of 48-hpf embryos, showing that melanophores accumulate on the head of TP-0903-treated embryos (17/19 embryos), which is rescued by DEAB co-treatment (17/20 embryos) and mimicked by direct RA treatment (19/20 embryos). |
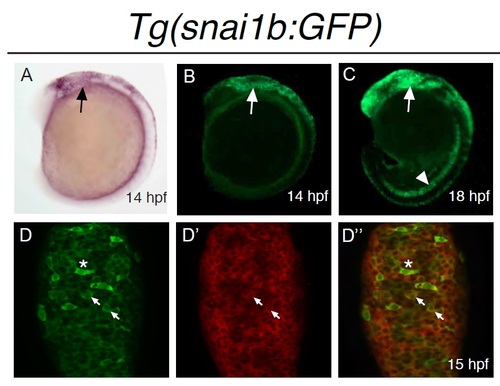
Expression of Tg(snai1b:GFP) During NC Development. Lateral views of (A) snail1b mRNA in situ hybridization compared to (B) GFP expression in Tg(snai1b:GFP) showing GFP-positive cells in cranial NC at 14 hpf (arrow). (C) By 18 hpf, GFP expression can be seen in the notochord (arrowhead) and within a subset of cranial NC streams (arrow). (D) Confocal maximal projection (4 µm) of dorsal view of hindbrain region in Tg(snai1b:GFP) embryos at 15 hpf processed for whole mount in situ hybridization of snail1b mRNA (red, D′) and immunofluorescence of GFP protein (green, D). Arrows highlight examples of co-localization between snail1b mRNA and GFP-positive cells in D′′. Cells expressing the highest leves of GFP (asterisk) apear mesenchymal and express decreased levels of snail1b mRNA. |