
- Title
-
An oxygen-insensitive Hif-3α isoform inhibits Wnt signaling by destabilizing the nuclear β-catenin complex
- Authors
- Zhang, P., Bai, Y., Lu, L., Li, Y., Duan, C.
- Source
- Full text @ Elife
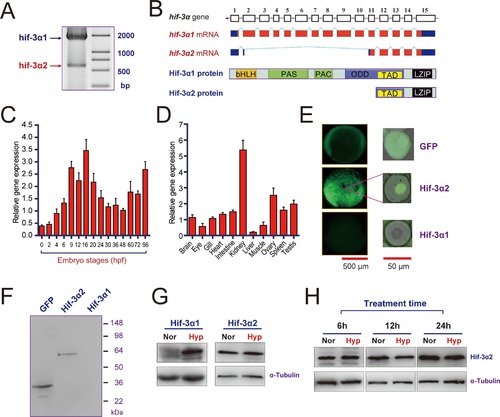
Hif-3α2 is an oxygen-insensitive Hif-3α isoform resulting from alternative splicing.(A) Hif-3α isoform 1 (Hif-3α1) and isoform 2 (Hif-3α2) mRNA expression. RNA isolated from zebrafish embryos was analyzed by RT-PCR. (B) Schematic illustration of the hif-3α gene (top), Hif-3α1 and Hif-3α2 mRNAs (middle), and proteins (bottom). (C,D) Hif-3α2 expression in early development (C) and in adult tissues (D). The Hif-3α2 mRNA levels were measured by qRT-PCR and normalized by β-actin levels. Values are means |

Hif-3α2 is a nuclear protein and has HRE-dependent transcriptional activity.(A) HRE-dependent transcriptional activity. HEK293 cells were transfected with the indicated plasmid together with 100 ng p2.1 (red) or p2.4 plasmid (black). The results are normalized and expressed as fold change over the GFP p2.4 group. Values are means |
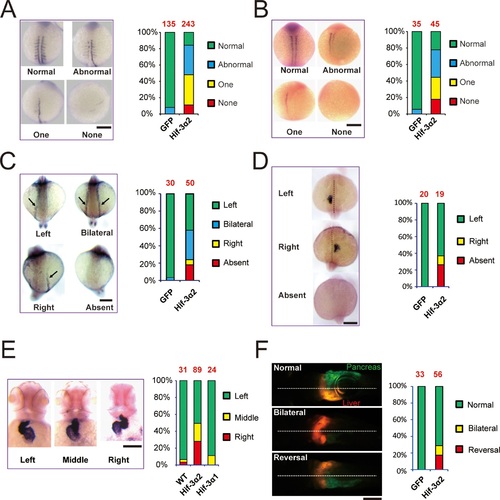
Forced expression of Hif-3α2 causes LR asymmetry defects..Embryos injected with GFP or Hif-3α2 capped mRNA (600 pg) were raised and analyzed by in situ hybridization. (A,B) Somite development was visualized by myod1 (A) and myog (B) mRNA expression at 12-14 hpf. The embryos were scored based on the criteria shown in the left panel. The quantification results are shown in the right. The total embryo number is shown on the top of each column. (C) Altered expression of spaw (C) mRNA at 18 hpf and lft2 mRNA (D) at 20 hpf. (E) The cardiac tube looping was visualized by cmlc2 mRNA expression at 48 hpf. Representative views are shown in the left panel. The quantification results are shown in the right panel. Hif-3α1 (stabilized Hif-3α1, 800 pg) injected embryos were used as controls. (F) Changes in liver and pancreas location. Hif-3α2 capped mRNA was injected into LiPan transgenic embryos. Liver (red) and pancreas (green) location was examined at 96 hpf. |

Forced expression of Hif-3α2 slows down embryonic growth and developmental timing and causes morphological abnormality.Body length (A) and somite number (B) of the embryos injected with the indicated capped mRNA (600 pg) were measured at 24 hpf and are shown. The total embryo number is shown at the top of each column. (C,D) Embryos were scored based on the morphological criteria shown in (C). The percentage of embryos in each category is shown in (D). The total number of embryos analyzed is shown at the top of each column. |
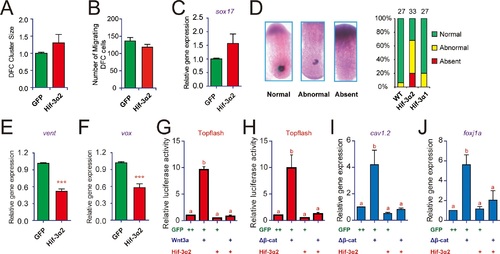
Forced expression of Hif-3α2 impairs Kupffer′s vesicle (KV) development and inhibits Wnt/β-catenin signaling.(A,B) Lack of effect on dorsal forerunner cell (DFC) development. The DFC cluster size (A) was determined by measuring sox17 mRNA expression domain in the Hif-3α2 mRNA injected embryos at 8 hpf (n = 22) using ImageJ. The values were normalized by those of the GFP mRNA injected embryos (n = 19). The number of migrating DFCs were quantified and shown in (B). (C) The sox17 mRNA levels were determined by qRT-PCR and normalized by the β-actin levels. Values are means |

Effects of Hif-3α2, Hif-3α1′ (a stabilized Hif-3α1), and Hif-1α′ (a stabilized Hif-1α) on Wnt3a- (A) and β-cateninΔN-induced (B) Topflash activity.Embryos injected with 90 pg Topflash plasmid DNA together with the indicated capped mRNA (600 or 800 pg) were raised to 9 hpf in normoxic water and luciferase activity was measured. Values are means +S.E. (n = 3). *, **, and ***p < 0.05, 0.01 and 0.001. ns, not significant. (C) Hif-3α2 overexpression antagonizes Wnt3a and β-cateninΔN actions. Zebrafish embryos were injected with the indicated capped mRNA. They were raised and photographed at 12 hpf. |

ZFIN is incorporating published figure images and captions as part of an ongoing project. Figures from some publications have not yet been curated, or are not available for display because of copyright restrictions. EXPRESSION / LABELING:
PHENOTYPE:
|
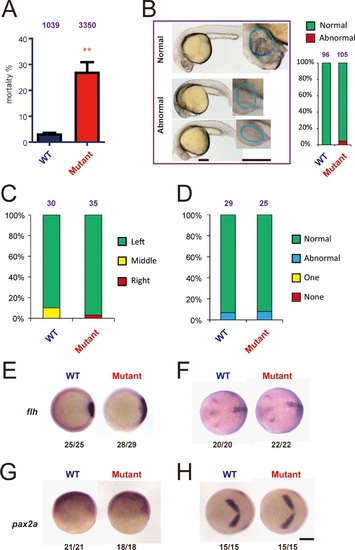
Genetic deletion of Hif-3α2 increases embryo mortality and transient Wnt/β-catenin signaling phenotype.(A) Increased embryo mortality. Wild-type and F3 homozygous hif-3αΔ42 mutant embryos were raised under normoxia. The number of dead embryo was determined at 9 hpf and is shown as percentage of total embryos. The total embryo number is shown on the top of each column. (B) Morphology of the surviving embryos at 24 hpf. The total embryo number is shown on the top of each column. (C,D) The cardiac tube looping (C) and somite development (D) were examined and quantified at 48 and 12–14 hpf. (E-H) Expression of flh and pax2.a mRNA in wide type and hif-3αΔ42 mutant embryos at 6 hpf (E,G) and 10 hpf (F,H). The frequency of embryos with the indicated expression patterns is shown at the bottom of each panel. Scale bar = 200 µm. |
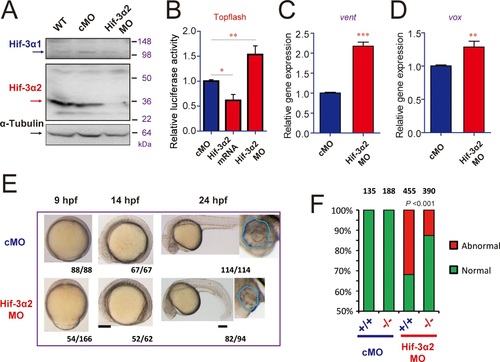
Hif-3α2 knockdown leads to Wnt/β-catenin signaling phenotypes.(A) Wild type (WT), control MO (cMO), and Hif-3α2 targeting MO (Hif-3α2 MO)-injected embryos were raised to 24 hpf in normoxic water. They were lysed and subjected to Western blotting. (B) Wild-type embryos injected with Topflash plasmid DNA together with the indicated capped mRNA or MO were raised to 9 hpf and the luciferase activity was measured. Values are means EXPRESSION / LABELING:
PHENOTYPE:
|
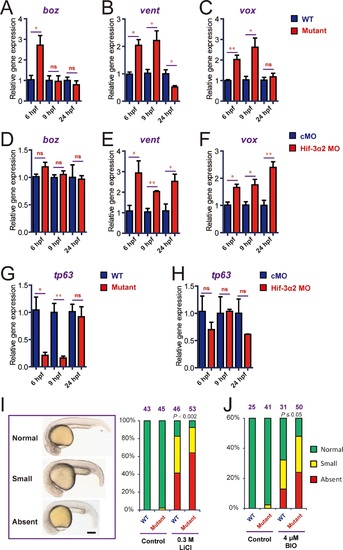
Genetic deletion but not knockdown of Hif-3α2 result in dynamic and compensatory changes in the expression of Wnt/β-catenin and BMP target genes.(A-C) Expression of boz (A), vent (B), and vox (C) in hif-3αΔ42 mutant embryos at the indicated stages. (D-F) Expression of boz (D), vent (E), and vox (F) in morphants at the indicated stages. (G,H) Expression of tp63 in hif-3αΔ42 mutant embryos (G) and morphants (H) at the indicated stages. In all above, the mRNA levels of the indicated genes were measure and presented as described above. Values are means +S.E. (n = 3). * and **p < 0.05 and P < 0.01. (I,J) Treatment of wild type and hif-3αΔ42 mutant embryos with LiCl (0.3 mM) and BIO (4 µM) results in no eyes or small eyes phenotypes. Representative views are shown in the left panel and quantification results are shown in the right panel. The total embryo number is shown on the top. P value of Chi analysis is shown. |