
- Title
-
Visualising apoptosis in live zebrafish using fluorescence lifetime imaging with optical projection tomography to map FRET biosensor activity in space and time
- Authors
- Andrews, N., Ramel, M.C., Kumar, S., Alexandrov, Y., Kelly, D.J., Warren, S.C., Kerry, L., Lockwood, N., Frolov, A., Frankel, P., Bugeon, L., McGinty, J., Dallman, M.J., French, P.M.
- Source
- Full text @ J. Biophotonics
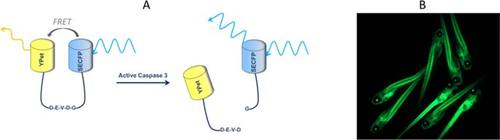
The Caspase 3 FRET biosensor design and its expression in transgenic fish. (A) In the Caspase 3 FRET biosensor, SECFP and Ypet are linked with a flexible 23 amino acid chain, which includes the Caspase 3 cleavage sequence DEVDG in the centre. Upon cleavage of this site in the presence of Caspase3, the SECFP and Ypet become unlinked and the fluorescence lifetime increases. (B) Tg(Ubi : Caspase3bios) zebrafish were generated using the TOL2 Gateway system. Founder fish were imaged at 5 dpf, using a GFP filter cube to assess transgene expression levels. |
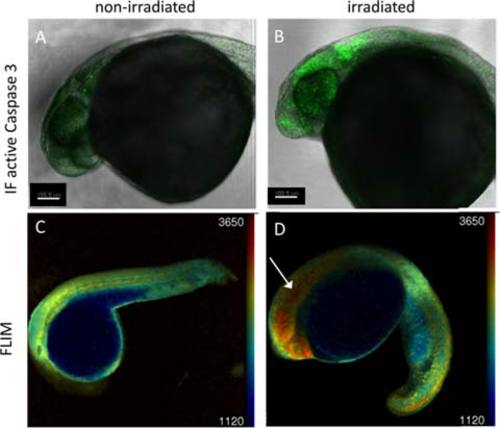
Validation of Caspase 3 biosensor activation following gamma irradiation using confocal microscopy. 24 hpf zebrafish embryos were irradiated (B, D) with 18 Gy from a 137Cs source or left untreated (A, C) and imaged at 3 hpi using confocal microscopy. (A, B) confocal fluorescence intensity images of TraNac embryos, either non-irradiated (A) or irradiated (B), fixed and labelled with an active Caspase 3 immunofluorescent antibody. (C, D) confocal fluorescence lifetime images of non-irradiated (C) and irradiated (D) Tg(Ubi : Caspase3bios) embryos at 3 hpi. |
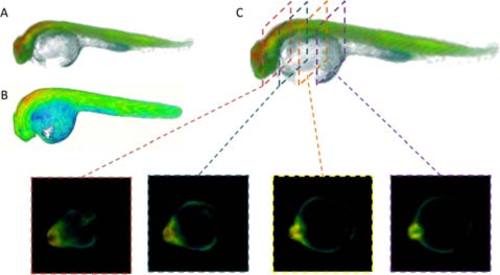
Figure 3. Region of interest selection for data analysis. Rendered 3-D images of 24 hpf Tg(Ubi : Caspase3bios) zebrafish following 25 Gy gamma irradiation, derived from FBP reconstruction and pixelwise fitting in FLIMfit to a single exponential decay model of (A) whole FLIM OPT data set, showing intensity merged false colour lifetime (B) whole FLIM OPT data set, showing false colour lifetime, without intensity merging, to highlight short lifetime contribution of yolk and (C) FLIM OPT data set showing the 2-D slices through the ROI of the reconstructed fluorescence lifetime image of the segmented dataset. |

Irradiation causes an increase in fluorescence lifetime at 3.5 hours in the head region of zebrafish. 24 hpf Tg(Ubi : Caspase3bios) were irradiated (C-F) with 25 Gy from a 137Cs source, or left untreated (A-C) and imaged at 1 hpi (A, D), 2 hpi (B, E) and 3.5 hpi (C, F) with FLIM OPT. 5 time gated images were acquired every 4°, through a full 360° rotation. Data was reconstructed using MATLAB, and fitted using a single pixelwise variable projection model in FLIMfit, giving the mean lifetime per pixel. 3D images were generated using the 3D viewer plug-in in FiJi. Histograms show frequency of pixel lifetimes. Centre histograms: head region. Edge histograms: tail region. |

A) Spectrally resolved fluorescence images of 48 hpf Tg(Ubi:Caspase3 biosensor) embryos: “Donor channel” corresponds to donor excitation & donor channel detection; “Acceptor channel” corresponds to acceptor excitation & acceptor channel detection; “FRET channel” corresponds to donor excitation & acceptor channel detection and “Corrected emission ratio” corresponds to the corrected mean acceptor/donor emission ratio calculated using FiJi following the protocol published by Kardash et al [27]. B) 48 hpf Tg(Ubi:SECFP) embryo (i.e. expressing only the donor fluorophore) showing cross-talk in acceptor channel. C) Graph showing a statistical significance of p>0.05 (*) between corrected mean acceptor/donor emission ratio of irradiated versus non-irradiated embryos. This corrected acceptor/donor emission ratio was averaged over all the pixels in each field of view and statistical analysis across multiple experiments was performed with n≥7 in each category using GraphPad Prism 6. Data showed a normal distribution so an unpaired t-test was used. |
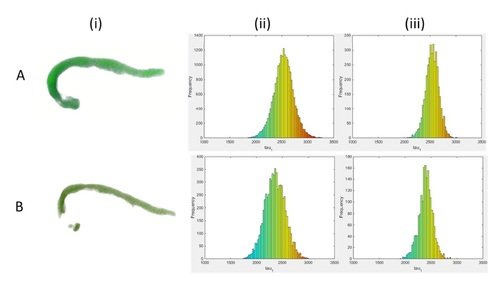
24 hpf Tg(Ubi:SECFP) zebrafish embryos were irradiated with 25 Gy and imaged at 3.5 hours post irradiation. Data was fitted using FLIMfit. i) False colour intensity merged lifetime map of Tg(Ubi:SECFP): A) irradiated, B) non-irradiated; ii-iii) corresponding pixel lifetime histograms, generated in FLIMfit: ii) segmented head, iii) segmented tail. |