
- Title
-
The Zebrafish scarb2a Insertional Mutant Reveals a Novel Function for the Scarb2/Limp2 Receptor in Notochord Development
- Authors
- Diaz-Tellez, A., Zampedri, C., Ramos-Balderas, J.L., García-Hernández, F., Maldonado, E.
- Source
- Full text @ Dev. Dyn.

The retroviral insertion in the scarb2a gene from zebrafish. A: Diagram of the scarb2a exon-intron structure and the location of the retroviral insertion at the first intron. Scarb2a protein is represented by a box in which the predicted positions of the two transmembrane domains (TM) and the predicted Asn residues for N-glycosylation sites are indicated by dotted lines. B: Phylogenetic tree using the zebrafish Scarb1 and CD36 sequences as an outgroup. The tree was built with MacVector 12.0 using “Neighbor joining” as the tree-building method in the Best tree mode with uncorrected “p” distance with the gaps distributed proportionally. Numbers above lines indicate substitutions per site. D.r. (Danio rerio “zebrafish”), C.i. (Ciona intestinalis), T.n. (Tetraodon nigroviridis “pufferfish”), X.t. (Xenopus tropicalis), M.d. (Monodelphis domestica “opossum”) and H.s. (Homo sapiens). C: Simultaneous DNA and total RNA purification from 20 phenotypic scarb2ahi1463Tg mutant embryos allowed us to determine that all tested embryos carried the mutagenic insertion in the scarb2a gene and at the same time were null for scarb2a because they could not express scarb2a mRNA. This was performed by genotyping by PCR and by RT-PCR amplification, respectively. D: Genotyping was conducted using three primers, two flanking the insertion (1463c and 1463c1) and one at the retroviral insertion site (MSL4) but oriented toward the 52-end primer. Approximately 80 adults raised from an outcross were fin clipped and genotyped, and then only the identified carriers (approximately 50%) were used to obtain homozygous scarb2ahi1463Tg embryos. E: Whole-mount in situ hybridization to detect the expression of scarb2a mRNA in 24 hpf embryos. scarb2a mRNA was not detected in approximately 1/4 of the embryos. In the other 3/4 of the embryos, the scarb2a RNA antisense probe was detected in the brain and the posterior notochord (see red arrows). |
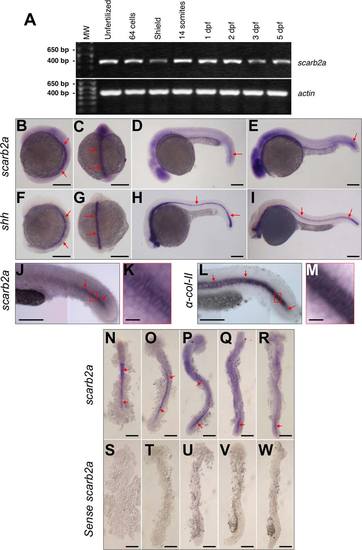
scarb2a mRNA expression. A: scarb2a RT-PCR from cDNA prepared from unfertilized eggs and different developmental stages; 64 cells, shield, 14 somites, 1, 2, 3 and 5 dpf. Actin-beta1 was also amplified from the same samples as a positive control of expression. B-E: ISH expression, in WT embryos, of scarb2a at the 6 somite (side and dorsal view), 26 somite and prim-12 developmental stages (side views). F-I: For comparison, shh was also used for ISH labeling of the notochord at the same developmental stages. J-M: Side views of the posterior trunk comparing scarb2a and α-collagen-II expression in the notochord. K: Magnified view (20X) of the region indicated by the red box in (J). M: Magnified view (20×) of the red box in (L). Photographs in (J) and (K) are composite images. N-R: Embryos labeled by scarb2a ISH and then flat mounted for detailed observation of notochord expression at the 10 somite, 14 somite, 18 somite, 21 somite and 24 hpf developmental stages. S-W: As a control, ISH was performed with the scarb2a sense probe at the same developmental stages. Red arrows indicate expression of the tested probes in the notochord. Scale bars = 250 µm, except those in panels K and M, which represent 25 µm in length. |
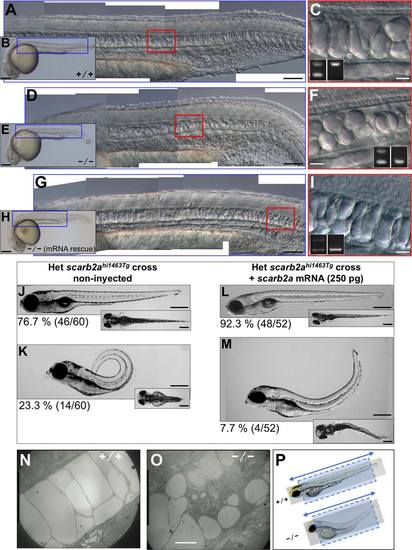
scarb2a mutant notochord and trunk defects. All embryos and larvae were obtained from scarb2ahi1463Tg heterozygous parents. A-C,J,L,N: Images from nonphenotypic (noncarrier) zebrafish embryos and larvae. D-I,K,M,O: Embryos or larvae homozygous for the scarb2ahi1463Tg mutagenic insertion. A,D,G: DIC microscopy images, composites of several photos obtained at 10X, corresponding to regions indicated in the blue boxes of low-magnification photos (B,E,H), respectively, but zoomed 5 times larger, allowing the observation of notochord characteristics in detail. C,F,I: The regions in red boxes in (A,D,G), respectively, zoomed 4 times larger to see the shape of notochord vacuoles; these images were obtained at 20X. Insets show the genotyping analysis demonstrating that the images in (A-C) were from a noncarrier embryo, images in (D-F) correspond to an homozygous mutant embryo, and the images in (G-I) were also from a homozygous embryo that does not show the small vacuole phenotype due to the micro-injection of scarb2a mRNA. A,D,G and C,F,I: Embryos at 1 dpf obtained with 10X and 20X objectives, respectively, using DIC microscopy. J-M: Rescue experiment showing 5 dpf non-microinjected larvae to the left and microinjected larvae to the right, in side views. Insets show the same larvae in dorsal views. While 23.3% of non-microinjected larvae from a scarb2ahi1463Tg heterozygous cross show the trunk upward-bending defect (phenotype), only 7.7% of the scarb2a mRNA microinjected larvae show the same defect, and it is less severe. The number in parentheses is the proportion of phenotypic larvae with respect to total larvae in the experiment. N,O,P: Electron Microscopy of WT and scarb2ahi1463Tg homozygous 3 dpf larvae. Longitudinal sections (dotted boxes) were obtained from sections made in the direction of the double arrowed line. A-M: These fish were genotyped as described in the Experimental procedures section. Scale bars = 250 µm in (B,E,H,J-M) 100 µm in (A,D,G) 20 µm in (C,F,I,N,O) respectively. PHENOTYPE:
|
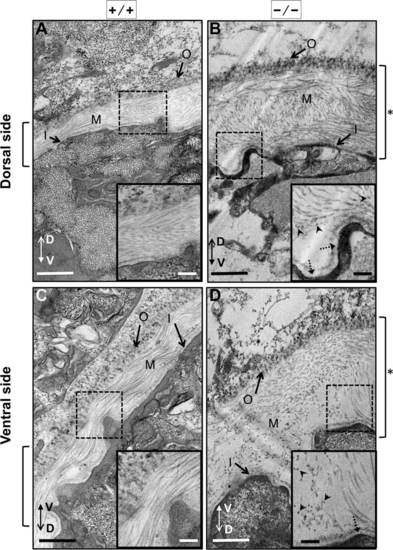
Electron microscopy analysis of the notochordal basement membrane from 30 hpf scarb2a mutants. All images shown are transverse cross-sections close to somite 16 of 30 dpf zebrafish embryos. In this figure, images were arranged so the outer layer of the basal membrane was oriented toward the top or top-left corner regardless of the embryo orientation. The dorso–ventral axis of the larvae is indicated by a double arrow. A,C: WT zebrafish embryos prepared for electron microscopy. B,D: Mutant embryos scarb2ahi1463Tg also prepared for electron microscopy. A,B: Images of the basal membrane at the dorsal side of the notochord. C,D: Images of the basal membrane at the ventral side of the notochord. All mutant embryos were genotyped first to ensure that they were scarb2ahi1463Tg homozygous embryos (see Experimental procedures). All images are shown at 5,000X magnification. Square brackets to the sides of each figure indicate basal membrane thickness, which was wider in the mutants (see asterisks). The insets show higher magnifications (10,000X) of selected regions (dotted boxes). Arrowheads point to electron-dense particles observed in the medial basal membrane in scarb2ahi1463Tg homozygous embryos, and dotted arrows point to thickened inner basal lamina in mutant embryos. Outer basal membrane (O), medial basal membrane (M) and inner basal membrane (I). Scale bars = 500 nm. PHENOTYPE:
|
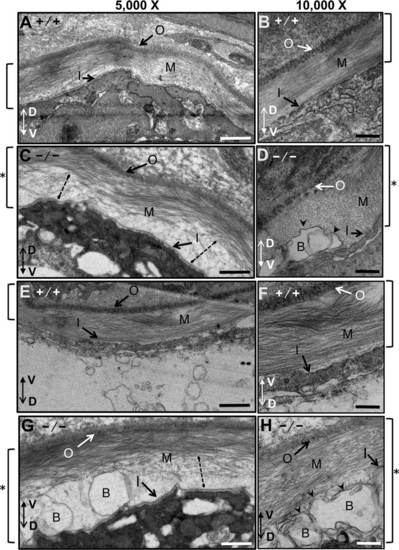
Notochordal basement membrane in WT and mutant zebrafish embryos at 3 dpf analyzed by electron microscopy. All images are transverse cross-sections from near somite 16. For this figure, images were oriented so the outer layer of the basal membrane is at the top, and the dorso-ventral axis of the larvae is indicated by a double arrow. A-D: Views of the basal membrane on the dorsal side of the notochord. E-H: Views of the basal membrane on the ventral side of the notochord. A,B,E,F: Wild-type embryos. C,D,G,H: scarb2ahi1463Tg mutant zebrafish embryos at 3 dpf. Images were obtained at either 5,000X or 10,000X. Square brackets to the sides of each figure indicate the thickness of the basement membrane, which was thicker in the mutants (see asterisks). Dotted lines in sections from mutant embryos show regions where collagen appears to be not properly assembled. Blisters (arrowheads) appear in mutant basal membranes just above the basal lamina of the inner layer. Outer basal membrane (O), medial basal membrane (M), inner basal membrane (I) and blisters (B). Scale bars = 500 nm. |