
- Title
-
Methyl-CpG Binding Protein 2 (Mecp2) Regulates Sensory Function Through Sema5b and Robo2
- Authors
- Leong, W.Y., Lim, Z.H., Korzh, V., Pietri, T., Goh, E.L.
- Source
- Full text @ Front. Cell. Neurosci.

FIGURE 1. Knocking down Mecp2 in zebrafish. Mecp2 is ubiquitously expressed throughout the CNS at 24 hpf (A). The embryos are displayed as whole mounts, dorsal view (F- forebrain, M - midbrain and H-hindbrain, S - spinal cord, E- eye) Scale bar = 60 μm. Schematic diagram shows gene structure of the zebrafish mecp2 and the mammalian (human or mouse) MeCP2α isoform (B). The zebrafish mecp2 gene consists of 3 exons with the main domains highlighted in red (Methyl-CpG-binding domain) and green (transcriptional repressor domain). The splice blocking morpholino targets the intron 1/exon 2 boundary on mecp2 pre-mRNA. Arrows below Zebrafish mecp2 gene show the positions where the forward and reverse primers were targeted [primer set 1 with black arrows for experiment in (C) and primer set 2 with gray arrows for (D)]. The specificity of morpholino was determined by RT-PCR (B,C). Representative gel images showing normal splicing of mecp2 as a band of 400 bp with actin (206 bp) as the control (C). Representative gel image showing normal splicing of mecp2 in WT (1455 bp) or blocked splicing band (exon skipping) (1086 bp) in mecp2 spliced MO injected embryos (D). Representative images showing gross morphological changes in TG neurons projections induced by mecp2 MO during development of zebrafish at 24 hpf (E). Scale bar = 50 μm. |
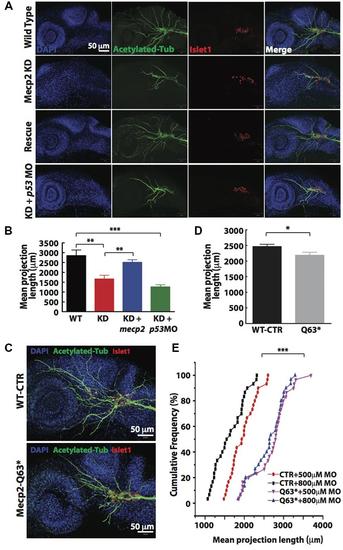
FIGURE 2. Knockdown of Mecp2 affects the axonal projection of trigeminal ganglion (TG) cells. Structure of peripheral dendritic projection and nerve pathways revealed by axon marker, acetylated tubulin (green), a general nucleus marker, DAPI (blue) and a neuronal marker, islet1 (red) at 24 hpf (A). Representative images showing peripheral axonal projections from sensory neurons of TG in wild-type controls (WT, top panel), Mecp2 morphants (second panel from top), Mecp2 morphants rescued by coinjecting mRNA of Mecp2 (third panel from top) and Mecp2 morphants coinjected with p53 MO (lower panel) (A). Quantitative analysis of total peripheral projections of trigeminal sensory neurons, with graph presenting total length of peripheral projections from trigeminal ganglia per zebrafish (B) N > 10. Representative images showing peripheral axonal projections from sensory neurons of TG in wild-type controls (WT, top panel) and mecp2Q63∗/Q63∗ mutants (Mecp2-Q63, bottom panel) (C). Graph showing quantitative analysis of peripheral projections (total length) from trigeminal ganglia per zebrafish in wild-type controls and mecp2Q63∗/Q63∗ mutants (D). Graph showing total neurite length of controls (CTR) and mecp2Q63∗/Q63∗ mutants (Q63) injected with either 500 or 800 μM of mecp2 MO (E). Scale bar = 50 μm. Each individual dot on graph (E) represents individual embryos. N = 30 in each group. (∗P < 0.05, ∗∗P < 0.01, ∗∗∗P < 0.0001, student t-test for (D) and one-way ANOVA with Bonferroni’s post hoc test for (B,E)]. PHENOTYPE:
|
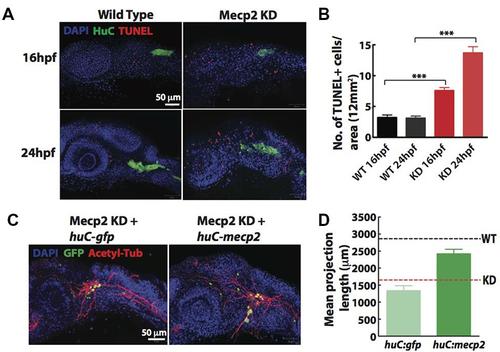
FIGURE 3. Cell autonomous effect of Mecp2 on sensory neurons during embryonic development. Embryos were injected with mecp2 MO and labeled with TUNEL. Antibody against HuC was used to label cell bodies in TG. Representative images showing TUNEL labeling in TG in wild-type controls (WT, left panel), Mecp2 morphants (right panel) (Blue – DAPI, Green – HuC and Red – TUNEL) (A). Quantitative analysis of TUNEL-labeled cells (indicative of apoptosis) at 16 and 24 hpf were presented in graphs showing total number of TUNEL positive cells per 12 mm × 12 mm in the head (B). Representative images showing peripheral axonal projections from sensory neurons of TG in Mecp2 morphants rescued by coinjection with huC-gfp control plasmids (left panel) or huC-mecp2 plasmids (right panel) (C). Quantitative analysis of total peripheral projections of trigeminal sensory neurons, with graphs presenting total length of peripheral projections from trigeminal ganglia per zebrafish (D). N > 10 in each group. Scale bar = 50 μm (∗∗∗P < 0.0001, one-way ANOVA with Bonferroni’s post hoc test). PHENOTYPE:
|

FIGURE 5. Sema5b and Robo2 rescue Mecp2-induced defects in axonal projections in TG. Representative gel images showing sema3f, sema5b and robo2 mRNA levels regulated by Mecp2 (A). Graph presenting quantitative RT-PCR of the three above mentioned genes in WT or Mecp2 MO injected embryos (B). Graph showing expression of sema3f, sema5b and robo2 mRNA in CTR and mecp2Q63∗/Q63∗ mutants using RT-PCR (C). Data are presented as fold expression of each gene normalized with housekeeping gene, beta-actin to value 1. (∗P < 0.05, ∗∗P < 0.01, ∗∗∗P < 0.001, two-way ANOVA with Bonferroni’s post hoc test). Sema5b and Robo2 rescue axonal projection of TG cells. Representative images showing peripheral projections of trigeminal sensory neurons in embryos injected with mecp2 MO together with mRNA of Sema5b, Robo2 or both (D). Quantitative analysis of total peripheral projections from trigeminal sensory neurons, with graph presenting total length of peripheral projections from trigeminal ganglia per zebrafish (E) (Blue – DAPI, Green – acetylated tubulin, Red – islet1). N > 10 in each group, Scale bar = 50 μm. |

FIGURE 7. Mecp2-mediated defects of axon projections leads to diminished sensory response. Representative images showing arrays of muscle fibers in WT control and Mecp2 morphants (KD) embryos immunostained with monoclonal antibody A4.1025 (myosin) (A). In all panels, anterior is to the left. (Blue-DAPI, red-myosin) Scale bar = 50 μm. Graphs showing rates of response upon tactile stimuli (red arrow in C) from the six experimental groups of WT and KD, including WT and KD coinjected with various rescue constructs indicated on the graph, upon tactile stimuli applied to the same region specified (B,C). Proposed model shows Mecp2 plays a part in primary sensory projections through regulating transcription of Sema5b and Robo2 (C). Each individual dot (B) represents individual embryos. N > 30. (∗∗∗P < 0.0001, one-way ANOVA with Bonferroni’ post hoc test). PHENOTYPE:
|