
- Title
-
The basal function of teleost prolactin as a key regulator on ion uptake identified with zebrafish knockout models
- Authors
- Shu, Y., Lou, Q., Dai, Z., Dai, X., He, J., Hu, W., Yin, Z.
- Source
- Full text @ Sci. Rep.

Prl-deficient zebrafish can survive only in brackish water. (A) The curve of survival rates of wild-type and prl-deficient larvae in regular zebrafish egg water and system water (FW, 60–175 mg/L IOS) or brackish water (BW, 5060–5175 mg/L IOS) (n = 100). (B) The general morphological observations of wild-type larvae (B1-B5) and prl-deficient larvae (B6-B10) during 4–8 dpf. The prl-deficient larvae exhibit defects in swim bladder inflation after 5 dpf (B8-B10), curved bodies at 6 dpf (B8), and obvious edema at 7–8 dpf (B9, B10). (C) Major ion contents were measured with wild-type larvae and prl-deficient larvae at 6 dpf cultured in FW and BW. Cation contents were assessed by the inductively coupled plasma-optical emission spectroscopy (ICP-OES) method and chloride assessed by chloride colorimetric assay kit. *significant difference (P < 0.05). At least twenty embryos were pooled as a sample for ion content analysis. (D) Representative healthy wild-type (left) and prl-deficient (right) adults cultured in brackish water at 100 dpf. IOS, Instant Ocean salts; dpf, days post-fertilization. E) Assessment of synthesized wild-type prl mRNA injection based on statistics of gas bladders inflated rates of wild-type larvae, prl-deficient larvae and prl-deficient larvae injected with prl mRNA at 5 dpf. PHENOTYPE:
|

Expression patterns of ionocyte progenitor markers. (A–H) Expression patterns of foxi3a (A,B) forkhead box I3a, an early marker for HR cells) and foxi3b (C,D) forkhead box I3b, an early marker for NaR cells) in wild-type (left) and prl-deficient (right) larvae at 24 hpf and ca2 (E,F) carbonic anhydrase II, a marker for HR cells) and atp1b1b (G,H) ATPase, Na+/K+ transporting, beta 1b polypeptide, a marker for NaR cells) in wild-type (left) and prl-deficient (right) larvae at 48 hpf. (I) counts of foxi3a, foxi3b and atp1b1b expression cells based on in situ results. (J) Expression levels of foxi3a and foxi3b (at 24 hpf), ca2 and atp1b1b (at 48 hpf) in total tissue from wild-type and prl-deficient larvae in regular zebrafish egg water via qRT-PCR assay. *significant difference (P < 0.05). Arrows, pronephric ducts; The qRT-PCR result shown here is the representative of the results obtained in two separate experiments. For in situ hybridization results, at least 17 embryos/genotype were analyzed in two separated experiments. For cell counts, 8 embryos were analyzed in two groups (N = 8). |
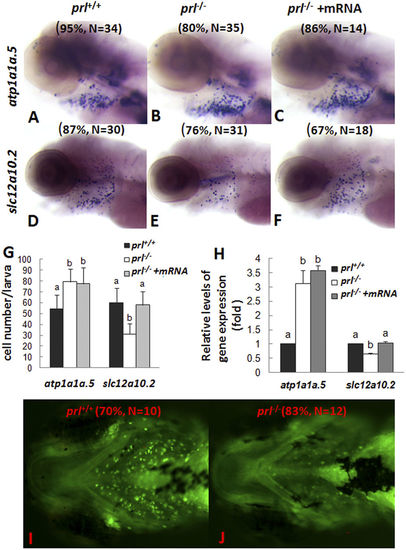
Expression patterns of ion transporters and sodium accumulation in gills of prl-deficient larvae. (A–F) Whole mount in situ hybridization assay of solute carrier family 12, member 10, tandem duplicate 2 (slc12a10.2) and ATPase, Na/K transporting, α 1a polypeptide, tandem duplicate 5 (atp1a1a.5) expression in gills of wild-type larvae (A,D), prl-deficient larvae (B,E) and prl -deficient larvae injected with prl mRNA (C,F) at 5 dpf in regular zebrafish egg water. (G) counts of atp1a1a.5 and slc12a10.2 expression cells in gills based on in situ results. (H) Expression levels of atp1a1a.5 and slc12a10.2 in head tissue from wild-type, prl-deficient larvae and prl-deficient larvae injected with prl mRNA at 5 dpf in regular zebrafish egg water via qRT-PCR assay. (I,J) Sodium green staining in gills of living larvae of wild-type (I) and prl-deficient larvae (J) at 6 dpf in regular zebrafish egg water (dorsal views). (a,b) different letters in two group mean significant difference (P < 0.05). The qRT-PCR result shown here is the representative of the results obtained in two separate experiments. For in situ hybridization results, at least 12 embryos/genotype were analyzed in two separated experiments. For cell counts, 8 embryos were analyzed in two groups (N = 8). |
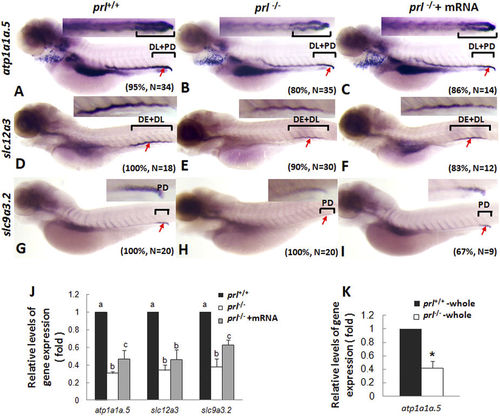
Expression patterns of ion transporters in pronephros of prl-deficient larvae. (A–C) Whole mount in situ hybridization assay of atp1a1a.5 expression in pronephros of wild-type larvae (A), prl-deficient larvae (B) and prl-deficient larvae injected with prl mRNA (C) at 5 dpf in regular zebrafish egg water. (D–F) Whole mount in situ hybridization assay of solute carrier family 12, member 3 (slc12a3) expression in pronephros of wild-type larvae (D), prl-deficient larvae (E) and prl-deficient larvae injected with prl mRNA (F) at 5 dpf in regular zebrafish egg water. (G–I) Whole mount in situ hybridization assay of solute carrier family 9, subfamily A, member 3, tandem duplicate 2 (slc9a3.2) expression in pronephros of wild-type larvae (G), prl-deficient larvae(H) and prl-deficient larvae injected with prl mRNA (I) at 5 dpf in regular zebrafish egg water. Insets in A-I: the amplified images of the pronephros. (J) Expression levels of atp1a1a.5, slc12a3, and slc9a3.2 in decapitated larvae body samples from wild-type, prl-deficient larvae and prl-deficient larvae injected with prl mRNA at 5 dpf in regular zebrafish egg water assayed via qRT-PCR assay. (K) Expression levels of atp1a1a.5 in total tissue from wild-type and prl-deficient larvae at 5 dpf in regular zebrafish egg water assayed via qRT-PCR assay. *significant difference (P < 0.05). (a–c) different letters in two group mean significant difference (P < 0.05). Arrows, pronephric ducts; The qRT-PCR result shown here is the representative of the results obtained in two separate experiments. For in situ hybridization results, at least 12 embryos/genotype were analyzed in two separated experiments. |

Analyses of Ca2+ uptake and bone formation in prl-deficient larvae. (A–C) Expression patterns of transient receptor potential family, vanilloid type 6 channel (trpv6) in gills of wild-type larvae (A), prl-deficient larvae (B) prl-deficient larvae embryos injected with wild-type prl mRNA larvae (C) at 5 dpf in regular zebrafish egg water. (D) qRT-PCR assay of trpv6 expression levels in the head tissue from wild-type, prl-deficient larvae and prl-deficient larvae injected with prl mRNA at 5 dpf in regular zebrafish egg water. (E,F) Expression patterns of stanniocalcin 1 (stc1) in the corpuscles of Stannius of wild-type (E) and prl-deficient larvae (F) at 5 dpf in regular zebrafish egg water. (G–L) Bone pattern assayed with the Alizarin staining for the wild type control larvae (G,H), prl-deficient larvae (I,J) in hypotonic water with low level Ca2+ added (salinity: 675 mg IOS/L, Ca2+: 71.68 mg/L), and prl-deficient larvae (K,L) in hypotonic water with high level Ca2+ added (salinity: 675 mg IOS/L, Ca2+: 143.36 mg/L) at 11 dpf. (G,I,K) dorsal views; (H,J,L) lateral views. (a,b) different letters between two groups mean significant difference (P < 0.05). Dpf, days post-fertilization; qRT-PCR, quantitative real time RT-PCR; IOS, Instant ocean salts. The qRT-PCR result shown here is the representative of the results obtained in two separate experiments. For whole mount in situ hybridization, at least 16 embryos/genotype were analyzed in two separated experiments. |

Decreased transcriptional expression of apical transporters in the pronephric duct of prl-deficient larvae. Expression patterns were assayed with whole mount in situ hybridization. A, B) Decreased expression of carbonic anhydrase II (ca2) in the pronephric ducts of prl-deficient larvae (B) compared with those of wild-type control fish (A) at 5 dpf in regular culture medium. C, D) Decreased expression of solute carrier family 12, member 10, tandem duplicate 3 (slc1210.3) in the pronephric ducts of prl-deficient larvae (B) compared with those of wild-type control fish (A) at 5 dpf in regular culture medium. Dpf, days post-fertilization. |

Down-regulation of ion transporter expression patterns of both wild-type and prl-deficient larvae at 5 dpf in BW. A-D) Whole mount in situ hybridization assay of slc12a10.2 (A, B) and trpv6 (C, D) expression in gills of wild-type (A, C) and prl-/- (B, D) larvae at 5 dpf in brackish water. E-J) Whole mount in situ hybridization assay of slc9a3.2 (E, F), atp1a1a.5 (G, H) and slc12a3 (I, J) expression in pronephric ducts of wild-type (E, G and I) and prl-/- (F, H and J) larvae at 5 dpf in BW. Dpf, days post-fertilization. |

Transcriptional expression patterns of prolactin receptors in early developmental stages as visualized by whole mount in situ hybridization analysis. A-B) Expression patterns of prolactin receptors a (prlra, A) and b (prlrb, B) at 48 hpf. C-D) Expression patterns of prlra (C) and prlrb (D) at 5 dpf. Hpf, hours post-fertilization; and dpf, days post-fertilization. |