
- Title
-
Origin, specification and plasticity of the great vessels of the heart.
- Authors
- Nagelberg, D., Wang, J., Su, R., Torres-Vazquez, J., Targoff, K.L., Poss, K.D., Knaut, H.
- Source
- Full text @ Curr. Biol.
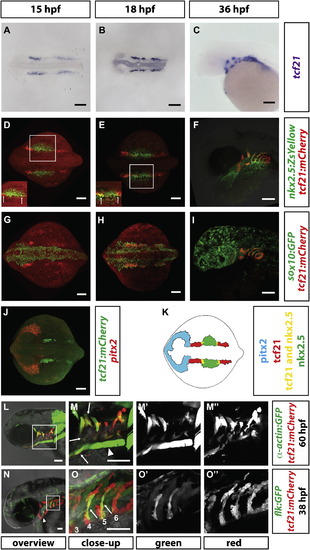
Expression of tcf21 during Head Formation (A–C) Staining of tcf21 mRNA in wild-type embryos of indicated stages. n > 7. (D–I) Images of fixed embryos of the indicated stages and genotypes stained for mCherry and ZsYellow proteins (D–F) or mCherry and GFP (G–I). White squares in (D) and (E) indicate region shown with increased intensity to demonstrate domain overlap in insets in (D) and (E). sox10:GFP was used to mark the neural crest contribution to the pharyngeal arches. Arrows in insets indicate region where tcf21 and nkx2.5 are co-expressed. n = 5 for (D) and (E); n = 1 for (F); n = 5 for (G); n = 2 for (H); n = 1 for (I). (J) Staining of pitx2 mRNA and mCherry protein in a 15-somite stage embryo (n = 13). (K) Schematic summary of pitx2, tcf21, and nkx2.5 expression in the head mesoderm in the 14-somite stage embryo. Note that in this study, the term “head mesoderm” refers to the mesoderm comprised of the prechordal plate mesoderm, the pharyngeal mesoderm, and the cardiac mesoderm. Pitx2, tcf21, and nkx2.5 mark—possibly only parts of—the prechordal plate, pharyngeal mesoderm, and pharyngeal mesoderm/secondary heart field mesoderm, respectively. (L–M′′) Live images of 60 hpf embryos carrying indicated transgenes. Square in (L) indicates magnified region in (M). (M′) and (M′′) show single fluorescent channels. Arrows in (M) indicate some of the tcf21+ muscles. Note that the prechordal plate-derived extraocular muscles (asterisk in M) and the somite-derived sternhyoideus muscles (arrowhead in M) do not express tcf21. (N–O′′) Live images of 38 hpf embryo carrying indicated transgenes. Square in (N) indicates magnified region in (O). (O′) and (O′′) show single fluorescent channels. Arrowhead in (N) indicates the HA progenitors. Arrows in (O) indicate tcf21+ pPAA progenitors, and the numbers label the arches. Note that the flk:GFP transgenic line weakly labels the pharyngeal endoderm and that PAA3 has already formed and lumenized and therefore is difficult to see in this projection. Scale bars represent 100 µm (A–J, L, and M) or 50 µm (N and O). Anterior is to the left. Dorsal views (A, B, D, E, G, H, and J) and lateral views (C, F, I, and L–O). EXPRESSION / LABELING:
|

tcf21+ Cells Contribute to the Head Muscles, the Head Vasculature, and the Outflow Tract of the Heart (A) Schematic representation of fate-mapping experiment. Images modified from [29]. (B) Image of tcf21:CreER; bactin2:RSG embryo stained for Myosin Heavy Chain and GFP to mark the head muscles and the Cre reporter, respectively. (C and D) Image of tcf21:CreER; bactin2:RSG embryo stained for Cdh5 and GFP to mark the vasculature and the Cre reporter, respectively. Square in (C) indicates magnified region in (D) (n = 8). (E) Summary of tcf21+ cell contributions to different tissues in wild-type embryos and in tcf21 mutant embryos assessed by live confocal microscopy (wt embryos, n = 95; tcf21/ embryos n = 34). Scale bars represent 100 µm (B and C) and 10μm (D). Anterior is to the left. Ventral views. From left to right: PA1, pharyngeal arch 1-derived skeletal muscle; PA2, pharyngeal arch 2-derived skeletal muscle; PA 3–6, skeletal muscle derived from PAs 3–6; pPAAs, pharyngeal arch arteries 3–6; HA, hypobranchial artery; VA, ventral aorta; other, other vascular labeling; OFT, outflow tract (myocardium, endothelium, smooth muscle, or epicardium); VM, ventricle (myocardium, endothelium, smooth muscle, or epicardium); other, cells derived from tcf21-expressing progenitors that we cannot unambiguously assign to a specific tissue. EXPRESSION / LABELING:
|

tcf21+ cells Are Required for Head Muscle Formation but Not for Head Vasculature Formation (A) Schematic representation of tcf21+ cell ablation experiment. Images modified from [29]. (B–Y′) Live images and schematic diagrams of embryos of indicated stages carrying indicated transgenes treated with the vehicle control DMSO or Mtz as depicted in (A). Note that in (F)–(I), the prechordal plate-derived extraocular muscles (arrows in F–I) and the somite-derived sternohyoideus muscles (asterisks in F–I, H′, and I′) are not ablated. Arrows in (J–Q, L′, and M′) indicate the HA; arrowheads point to the loop formed by the PAA 1 and the opercular artery, and numbers indicate PAAs 3–6. Note that the HA is missing in the tcf21+ cell-ablated embryos. Note that in (V)–(Y) (schematic diagrams X′ and Y′), all nkx2.5+ cells outside of the heart and pericardium are ablated. The light green color in (T2) and (U2) marks the nkx2.5+ head muscles. The nkx2.5+ endothelial cells are indicated by dark green. The scale bar represents 100 µm. Anterior is to the left. Lateral views (first, third, and fifth column) and ventral views (second, fourth, and sixth column). Sample number of imaged embryos is indicated as a total for the ventral and lateral views. See also Figure S1. EXPRESSION / LABELING:
PHENOTYPE:
|

Specification of the Ventral Head Muscles Requires Tcf21 Activity (A–X′) Live images and schematic diagrams of embryos of indicated stages and genotypes carrying the indicated transgenes. In mutants, most muscles expressing tcf21 are absent or severely reduced (A–H, C′, D′, G′, H′). Extraocular muscles (arrows in E–H) and sternohyoideus muscles (asterisks in E–H, G′, H′) do not express tcf21 and are not affected in tcf21 mutant embryos. Arrowheads in (R)–(T) and (V)–(X) indicate the HA, and numbers indicate pPAAs 3–6. Note that the HA is formed incompletely in the tcf21 mutant embryos (V, X, X′). The light green color in (K′) and (L′) marks the nkx2.5+ head muscles. The nkx2.5+ endothelial cells are indicated by dark green. Lateral views (first, third, and fifth column) and ventral views (second, fourth, and sixth column). Sample number of imaged embryos is indicated as a total for the ventral and lateral views. EXPRESSION / LABELING:
PHENOTYPE:
|

Specification of the Ventral Head Vasculature Requires the Combined Activities of Tcf21 and Nkx2.5 (A-P′) Live images and schematic diagrams of embryos of indicated stages and genotypes carrying the indicated transgenes. Squares in (A), (E), (I), and (M) indicate magnified regions shown in (B), (F), (J), and (N). Numbers indicate PAAs 3–6 in (B), (F), (J), and (N). Arrowheads indicate the HA. Lateral views (first and second column) and ventral views (third, fourth, and fifth column). Anterior is to the left. The scale bar represents 100 µm. Note that the images in (B), (F), (J), and (N) are thresholded using an ImageJ custom-written macro to only show the endothelial cells (see ImageJscripts2.ijm in Data S1). (Q) Quantification of the contribution of nkx2.5+ cells to the PAAs 3–6 in wild-type (includes tcf21-/+; nkx2.5-/+ and tcf21-/+; nkx2.5-/+ embryos, n = 37), tcf21 mutant (includes tcf21/ nkx2.5-/+ embryos, n = 13), nkx2.5 mutant (includes nkx2.5/ tcf21-/+ embryos, n = 10), and tcf21; nkx2.5 double mutant embryos (n = 10). Individual data points and the mean with the SEM are indicated. See also Figures S2 and S3. In cases involving tcf21; nkx2.5 double mutant embryos where contribution of nkx2.5+ cells to PAAs was ambiguous due to the presence of neighboring dying nkx2.5+ cells, scoring reflects a baseline assumption of nkx2.5+ cell contribution. (R) Quantification of lumenized PAAs of indicated genotypes at 60 hpf. The sample numbers for each genotype are: wild-type embryos (includes tcf21-/+; nkx2.5-/+ and tcf21-/+; nkx2.5-/+ embryos) n = 19, tcf21 mutants (includes tcf21/ nkx2.5-/+ embryos) n = 5, nkx2.5 mutants (includes nkx2.5/ tcf21-/+ embryos) n = 7, and tcf21; nkx2.5 double mutant embryos n = 3. |

Endothelial Cells from the Dorsal Head Vasculature Compensate for Lost pPAAs in tcf21 Cell-Ablated Embryos and tcf21/ nkx2.5/ Embryos (A–D) Live images of two embryos of indicated stages and genotypes carrying the indicated transgenes and treated with Mtz as described in Figure 3A. Numbers in (A) and (C) indicate the PAA, and arrows in (B) and (D) indicate the pPAAs. Images correspond to the first and last frames in Movie S4. (E) Schematic of experimental design. cdh5:Gal4FF; tcf21:mCherry-NTR embryos were injected at the one-cell stage with UAS-Kaede DNA. The embryos were treated with Mtz to ablate the tcf21+ cells as shown in Figure 3A. Embryos with green Kaede expression in the dorsal head vasculature were imaged, Kaede was photoconverted from green to red, and the contribution of endothelial cells in the dorsal head vasculature to the pPAAs was assessed 24 hr later. (F) Mtz-treated cdh5:Gal4FF; tcf21:mCherry-NTR embryo with mosaic green Kaede expression in the head vasculature. Dying tcf21+ cells are expressing mCherry protein. (G) Same embryo as in (F), but Kaede-expressing endothelial cells in the dorsal head vasculature have been photoconverted from green to red. Region of photoconversion is marked by a rectangle in (F). (H and I) Same embryo as in (F) 24 hr post-photoconversion. Photoconverted dorsal endothelial cells have migrated ventrally to compensate for the ablated pPAA progenitors and contribute to the pPAAs (arrowheads in I). Square in (H) indicates magnified region shown in (I) (n = 2). (J) Mtz-treated cdh5:Gal4FF embryo not transgenic for tcf21:mCherry-NTR with mosaic green Kaede expression in the head vasculature (n = 8). (K) Same embryo as in (J), but Kaede-expressing endothelial cells in the dorsal head vasculature have been photoconverted from green to red. Region of photoconversion is marked by a rectangle in (J). (L and M) Same embryo as in (J) 24 hr post-photoconversion. Photoconverted, dorsal endothelial cells do not migrate ventrally and do not contribute to the pPAAs (arrowheads in M). Square in (L) indicates magnified region shown in (M). Scale bars represent 100 µm. Anterior is to the left, and dorsal is up. (N–S′′) Live images of two embryos of indicated stages and genotypes carrying the indicated transgenes. Numbers in (N)–(S) indicate the PAA, and arrows in (O), (O′′), (Q), (Q′′), (S), and (S′′) indicate endothelial cells that are migrating into arch 6 to form PAA 6. (O′), (Q′), and (S′) show the green channel only (nkx2.5:ZsYellow), and (O′′), (Q′′), and (S′′) show the red channel only (flk:mCherry). Images correspond to time points 51, 51.5, and 52 hpf (frames 11, 12, and 13) in Movie S6. Lateral views. Anterior is to the left. Scale bars represent 100 µm. |
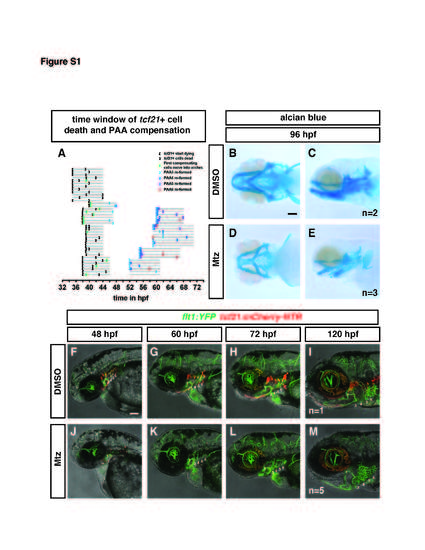
Related to Figure 3. pPAAs and cartilage form in the absence of tcf21+ cells. (A) Graphical depiction of the time window in which tcf21+ cells die in Mtz-treated tcf21:mCherry-NTR; flk:GFP embryos and of the time window in which the PAA 3-6 recover in Mtz-treated tcf21:mCherry-NTR; flk:GFP embryos. Gray lines are timelines and indicate the length (the beginning and the end) of the movies analyzed. The open brackets indicate the beginning of dying tcf21+ cells and the beginning of the compensation (beginning of sprouting endothelial cells) in black and green, respectively. The closed brackets indicate the completion of tcf21+ cell ablation and the completion of the connection of the compensating PAA3, 4, 5 or 6 from the LDA to the VA in black and light blue, dark blue, purple and red, respectively. Please note that brackets at the beginning of a timeline of a given movie indicate that the indicated process has started or finished but that the exact time of the indicated event is before the beginning of the movie. (B-E) Alcian blue-stained embryo at 96 hpf without (B-C) or following (D-E) treatment with Mtz. While head size is reduced in tcf21+ cell-ablated embryos, head cartilage still forms (D-E). (F-M) Individual flt1:YFP; tcf21:mCherry-NTR embryos are followed from 48 to 120 hpf without (F-I) or following treatment with Mtz (J-M). In the control embryo, PAAs 3-6 form normally, though PAAs 3 and 4 are not labeled due to transgene variability which affects PAAs 3 and 4 in this transgenic line (F-I). In the Mtztreated embryo, PAAs 3-6 are absent at 48 hpf following ablation (J), are remade but partially lumenized at 60 and 72 hpf (K and L) and fully remade at 120 hpf (M). Number of imaged embryos is indicated. Scale bars are 100 µm. |

Related to Figure 4. Head cartilage forms and the overall heart morphology is not affected in the absence of tcf21. (A) Schematic representing the tcf21 genomic locus and the region deleted in the tcf21 Δ236 mutant. Scale bar is 100 bp. (B) Comparison of heart beat frequencies in wild-type and tcf21 mutant embryos at indicated stages. n = 6 for all stages and genotypes. Individual data (grey dots), mean and SD are shown. (C-H) Wild-type embryo (C-E) and tcf21 mutant embryo (F-H) at indicated stages. Alcian blue staining indicates that the head cartilage still forms in tcf21 mutant embryos (F, G) although the head size is reduced compared to wild-type embryos (C, D). The overall morphology of the heart is not affected in tcf21 mutant embryo based on myocardium-specific GFP expression (E and H). Embryos shown in E and H were fixed in 4% PFA and imaged without further staining. Scale bars are 100 µm. Ventral views (C, E, F, H) and lateral views (D, G). n indicates the number of imaged embryos. (I) Quantification of the contribution of tcf21+ cells to PAAs 3 to 6 in wild-type (includes tcf21-/+; nkx2.5-/+ and tcf21-/+; nkx2.5-/+ embryos, n=12), tcf21 mutant (includes tcf21-/-; nkx2.5-/+ embryos, n=15), nkx2.5 mutant (includes nkx2.5-/-; tcf21-/+ embryos, n=13) and tcf21; nkx2.5 double mutant embryos (n=4). Individual data points and the mean with the SEM are indicated. Note that using mCherry expressed from the tcf21 promoter is a less appropriate marker for labeling the pPAA progenitors compared to nkx2.5:ZsYellow (Figure 5Q) for two reasons. First, the perdurance of the mCherry in the pPAA progenitors is shorter leading to dimmer labeling of tcf21+ cells, especially in the anterior pPAA 3, which is likely resulting from the differentiation of the PAAs in an anterior to posterior fashion. This may result in erroneous scoring of PAAs as having less pPAA progenitor contribution than seen when using nkx2.5:ZsYellow as a pPAA progenitor marker. Second, a specific subpopulation of anterior and ventral endothelial cells in the LDA express tcf21. Therefore, compensating endothelial cells from the LDA may be scored as tcf21+ although they do not represent pPAA progenitors. This is not the case for compensating cells from the PHS, which do not express tcf21. However, as nkx:ZsYellow is not expressed in either the LDA or PHS, this is likely to account for differences seen when comparing results using tcf21:mCherry-NTR versus nkx2.5:ZsYellow as a marker for pPAA progenitors. |

Related to Figure 5. Efficient specification of pPAA progenitors requires the combined activity of Tcf21 and Nkx2.5. (A-D) 36 hpf tcf21:mCherry-NTR embryos of indicated genotypes stained for tie1 mRNA (red) and mCherry (cyan) expression. The mCherry and tie1 fluorescent signals are shown separately in A′-D′ and A′′-D′′, respectively. Numbers in A-D indicate the pharyngeal arches 2-6. Note that the tcf21+ cells in the first two pharyngeal arches are dying in embryos without Tcf21 function. Anterior is to the left and dorsal is up. The scale bar in D corresponds to 100 µm. Wild-type embryos, n = 19 (includes tcf21-/+ and or nkx2.5-/+ embryos), tcf21-/- embryos n = 8 (includes nkx2.5-/+ embryos); nkx2.5-/- embryos (includes tcf21-/+ embryos), n = 5; tcf21-/-; nkx2.5-/- embryos, n = 3. tie1 signal is shown only when colocalizing with mCherry, as detected using a custom-written imageJ macro (Data S3). |