
- Title
-
A role of glypican4 and wnt5b in chondrocyte stacking underlying craniofacial cartilage morphogenesis
- Authors
- Sisson, B.E., Dale, R.M., Mui, S.R., Topczewska, J.M., Topczewski, J.
- Source
- Full text @ Mech. Dev.
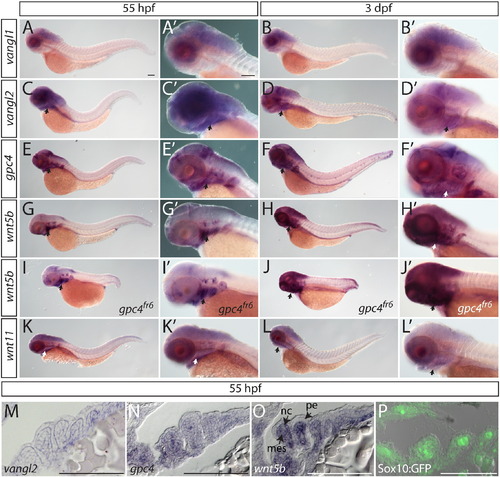
Expression of Wnt/PCP molecules in the zebrafish head of 55 h hpf and 3 dpf embryos. (A–H′, K–L′) In situ hybridizations of whole mount wild type embryos. (I–J′) wnt5b expression in gpc4fr6 mutant embryos. (A–L′) Arrows indicate staining in the pharyngeal arches. (M–P) Sections of whole mount in situ hybridizations. (M) vangl2 is expressed in the mes and nc. (N) gpc4 is expressed in the pe, mes and the nc. (O) wnt5b is expressed in the mes and nc. (P) Sox10:GFP expression in the mes and in the nc. Abbreviations: mes = mesoderm, nc = neural crest, pe = pharyngeal endoderm. Scale bar = 100 µm. EXPRESSION / LABELING:
|

A subset of Wnt/PCP molecules influence craniofacial cartilage development. (A–F) Not all identified core Wnt/PCP zebrafish mutants have a craniofacial chondrocyte stacking defect. Confocal images of whole-mount Wheat Germ Agglutanin (WGA) staining (gray) of Wnt/PCP mutant embryo heads at 4 dpf. Scale bar = 50 µm. (G–L) Confocal images of a single focal plan of WGA staining (gray) of Wnt/PCP mutant craniofacial cartilage elements at 4 dpf. Nuclei were labeled with DAPI (blue). Scale bar = 20 µm. M. Graph of length to width ratio. The y-axis is all 40 chondrocyte measurements from 4 different ceratohyals for wild type and mutant genotypes. The x-axis is the length to width ratio with a graphical representation of select ratios. The mean LWR and their respective standard deviation is marked by red cross-hairs and stated in Supplemental Table 1. To determine if data could be compared pairwise the D′Agostino and Pearson omnibus normality test was used. Mann–Whitney U was determined and the statistical significances between the means is marked on graph and stated in Supplemental Table 1. Abbreviations: M = Meckel′s cartilage, CH = ceratohyal, CB = ceratobranchial, HM = hyomandibular, IH = interhyal joint, and PQ = palatoquadrate. (For interpretation of the references to color in this figure legend, the reader is referred to the web version of this article.) PHENOTYPE:
|
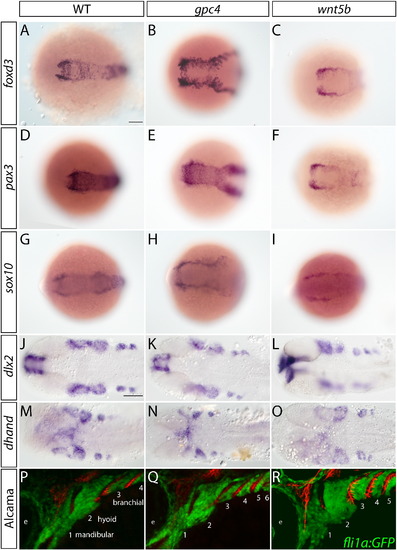
Cranial neural crest cell migration and specification is unaffected in gpc4 and wnt5b mutants. (A–O) Neural crest specification appears normal within gpc4 and wnt5b mutants Scale bar = 100 µm. (A–I) Pre-migratory neural crest markers. 6 somites. (J–O)Pharyngeal arch markers. (J–L) 28 hpf. (M–O) 32 hpf. (P–R) Migration of neural crest appears to be unaffected in gpc4 and wnt5b mutants when compared to wild type fish. Tg(fli1a:EGFP)y1 embryos have neural crest derived cells labeled by GFP expression. Embryos were fixed at 33 hpf and stained with the Alcama (Zn5) antibody (red). Pharyngeal arches are numbered. Scale bar = 50 µm. EXPRESSION / LABELING:
PHENOTYPE:
|
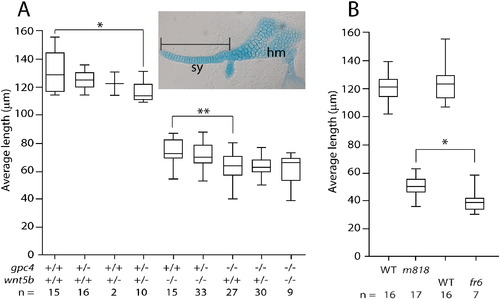
The gpc4 mutant craniofacial phenotype is not enhanced by the loss of wnt5b. (A–B) The length of the symplectic element (see inset) from 5 dpf embryos. (A) Measurements of the symplectics from progeny of a dihybrid cross of gpc4m818 and wnt5bta98. The presence of wnt5bta98 does not enhance the gpc4m818 phenotype, but the double heterozygous mutant is significantly different than wild type. Tests of 14 a priori hypotheses were conducted using a Bonferroni adjusted alpha level of 0.00357 (0.05/11). *p = 0.0015, Mann–Whitney U (df) = 20. **p = 0.0021, Mann–Whiney U (df) = 88. (B) The symplectic cartilage is significantly smaller in gpc4fr6 mutants than the symplectic elements in gpc4m818 mutants. *p = 0.0157, Mann–Whitney U (df) = 22. Abbreviations: sy = symplectic, hm = hyomandibular. |
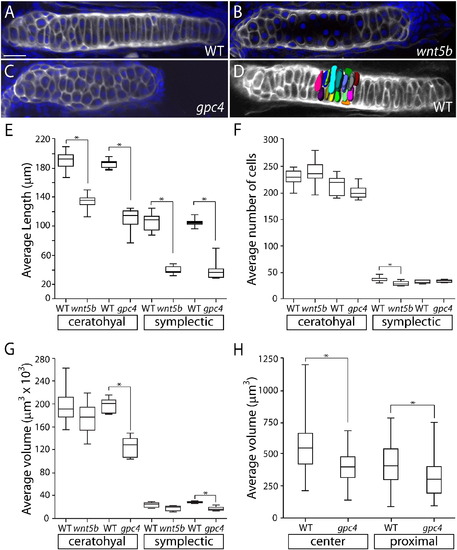
Craniofacal cartilage volume is reduced in gpc4 mutants while the numbers of cells is unchanged. (A–C) Wheat germ agglutinin (gray) and DAPI (blue) staining of ceratohyal elements. (D) A 3D reconstruction of 20 cells in the center of a wild type ceratohyal stained with WGA to determine cell volume. (E) There is a significant difference between the average length of the ceratohyal and symplectic elements between the wild type and mutants. All are p = < 0.001. (F) The average number of cells in ceratohyal and symplectic elements. (G) The average volume of the ceratohyal and symplectic elements. The ratio of the ceratohyal element volume is Vfr6/VWT = 0.63. (E–G) Tests of four a priori hypotheses were conducted using a Bonferroni adjusted alpha level of 0.0125 (0.05/4). *p < 0.0125. (H) The average volume of 20 cells in the center and proximal ends from three ceratohyal elements from gpc4fr6 embryos and their phenotypically wild type siblings. Tests of two a priori hypotheses were conducted using a Bonferroni adjusted alpha level of 0.025 (0.05/2). *p < 0.025. The ratio of the center chondrocyte volume is Vfr6/VWT = 0.71. The ratio of the proximal chondrocyte volume is Vfr6/VWT = 0.74. Scale bar = 20 µm. PHENOTYPE:
|
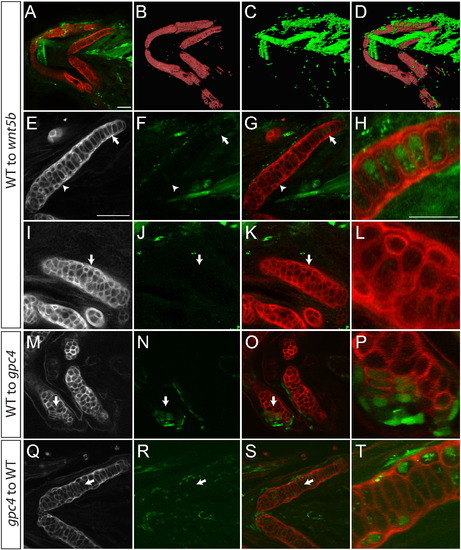
In craniofacial cartilage gpc4 acts autonomously. Transplantations to test for cell autonomy. (A–H) Transplanted wild type cells appear to rescue the wnt5b phenotype in the ceratohyal. (B–D) 3D reconstruction of panel A. (E–H) The ceratohyal with transplanted cells shown in A. Arrow indicates elongated transplanted cells surrounded by mesodermal transplanted cells. (H) Enlargement of area indicated in E–G by the arrow. (I–L) The certatohyal that is not transplanted with wild type cells in panel A retains its wnt5b phenotype. (I–K) Arrows indicate region of enlargement shown in L. (M–P) Wild type transplanted cells into a gpc4 Meckel′s cartilage are cell autonomous and elongate (arrow). (P) Enlargement of M–O at arrow. (Q–T) gpc4 transplanted cells to a wild type host are cell autonomous and are rounder than wild type cells. (T) Enlargement of L–N at arrow. (E–Q) Wheat Germ Agglutinin (WGA) staining of ceratohyal cartilage. (F, J, N and R) Transplanted cells marked by streptavidin. (A–G, I–K, M–O, Q–S) scale bars = 50 µm. (H, L, P, T) scale bar = 25 µm. WGA (red), transplanted cells marked by Alexa-Streptavidin (green). |
. Examples of wnt11 derived mutants. (A–B) Confocal images of a single focal plan of WGA staining (gray) of Wnt/PCP mutant craniofacial cartilage elements at 4 dpf. Nuclei were labeled with DAPI (blue). Scale bar = 20 µm. (A) A wnt11 embryo with a cyclopic index of 2 demonstrating while the cartilage elements are deformed, chondrocytes are still able to elongate. (B) Confocal images of a single focal plan of a wnt5b; wnt11 double mutant demonstrating the loss of chondrocyte elongation and stacking similar to the wnt5b single mutant. |
Reprinted from Mechanisms of Development, 138 Pt 3, Sisson, B.E., Dale, R.M., Mui, S.R., Topczewska, J.M., Topczewski, J., A role of glypican4 and wnt5b in chondrocyte stacking underlying craniofacial cartilage morphogenesis, 279-90, Copyright (2015) with permission from Elsevier. Full text @ Mech. Dev.