
- Title
-
The aPKC/Par3/Par6 polarity complex and membrane order are functionally inter-dependent in epithelia during vertebrate organogenesis
- Authors
- Abu-Siniyeh, A., Owen, D.M., Benzing, C., Rinkwitz, S., Becker, T.S., Majumdar, A., Gaus, K.
- Source
- Full text @ Traffic
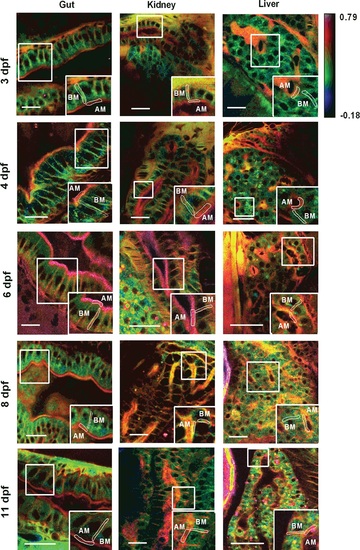
GP images of zebrafish gut, kidney and liver at different development stages. At 3–11 dpf, zebrafish larvae were stained with Laurdan, intensity images of the gut, kidney and liver recorded with a 2-photon microscope and the images converted to GP images. GP images were pseudo-colored with red indicating ordered membranes with high GP values and blue indicated fluid membranes with low GP values as per color scale. Apical (AM) and basolateral (BM) membranes were identified from the tissue morphology as shown in the zoomed regions (white squares). Scale bar = 20 µm. |
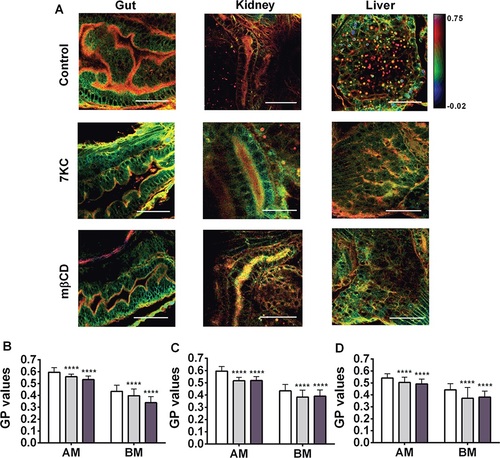
Membrane order in sterol-manipulated zebrafish larvae. A–D) Six dpf larvae were left untreated (Control; white bars in B–D), enriched in 7KC (100 µm, 30 min; light grey bars in B–D) or depleted of cholesterol with methyl-β-cyclodextrin (mβCD, 2.5 mm, 40 min; dark grey bars in B–D), stained with Laurdan and GP images (A) and GP values (B–D) obtained for epithelial cells in the gut (B), kidney (C) and liver (D) as in Figures 1 and 2. In (A), scale bar = 20 µm. In (B–D), data are mean and standard deviations from 75 regions in 15 larvae corresponding to the apical membranes (AM) and basolateral membranes (BM). ****p < 0.0001 relative to Control (one-way ANOVA with Bonferroni post-test). |

Recovery of membrane order after sterol modification. Four dpf larvae were left untreated (Control), enriched in 7KC (100 µm, 30 min) or depleted of cholesterol with methyl-β-cyclodextrin (mβCD, 2.5 mm, 40 min) as described in Figure 3, and either imaged and analyzed at that stage (A) (4 dpf) or allowed to develop to 6 dpf. B) GP values quantified for apical membrane (AM) of epithelial cells in the gut, kidney and liver at 4 dpf and 6 dpf. In (A), scale bar = 20 µm. In (B), data are mean and standard deviations from 50 regions in 10 larvae corresponding to the apical membranes (AM). **p < 0.01; ***p < 0.001 and ****p < 0.0001 relative to corresponding data at 4 pdf and 6 dpf (Student t-test). |

Localization of aPKC in epithelial cells in the gut, kidney and liver of sterol-manipulated zebrafish larvae. Untreated (Control), 7KC-enriched (7KC) and cholesterol depleted (mβCD) zebrafish larvae that were treated at 4 pdf or treated at 4 dpf and left to recover to 6 dpf were fixed and immuno-stained for aPKC (green) and ZO-1 (red) while nuclei were stained with DAPI (blue). From confocal images (A), the ratio of the aPKC intensity of apical (indicated by red dotted oval) and cytoplasm (indicated by yellow dotted oval) was extracted and calculated in (B). In (A), scale bar = 5 µm. In (B), data are mean and standard of 100 of ROI. ns, not significant, p > 0.05; **p < 0.01; ****p < 0.0001 relative to Control (one-way ANOVA with Bonferroni post-test). |
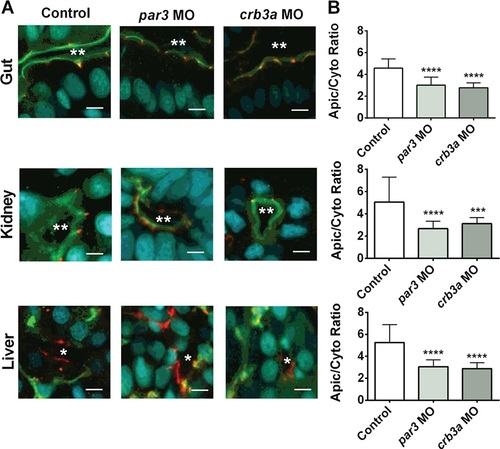
Localization of aPKC in epithelial cells in the gut, kidney and liver in morpholino-treated zebrafish larvae. At 1–4 cell stage, embryos were left untreated (Control, white bars) or injected with morpholinos against Par3 (Par3 MO, light grey bars) and Crb3a (Crb3a MO, dark grey bars) and were immuno-stained for aPKC (green) and ZO-1 (red) and nuclei were stained with DAPI (blue). From confocal images shown in A, the apical/basolateral ratio for aPKC was determined (B). In (A), scale bar = 5 µm; ** represent lumen in gut and kidney, * represent liver sinusoids. In (B), data are mean and standard of 100 measurements obtained from 10 larvae. ***p < 0.001; ****p < 0.0001 relative to Control (one-way ANOVA with Bonferroni post-test). |

Membrane order in morpholino-treated zebrafish larvae. At 1–4 cell stage, embryos were left untreated (Control, white bars) or injected with morpholinos against Par3 (par3 MO, light grey bars) and Crb3a (crb3a MO, dark grey bars) and grown to 4 dpf. A) GP images were obtained for epithelial cells in gut, kidney and liver and (B) GP values obtained from 50 apical (AM) and basolateral membranes (BM) from 10 larvae. Scale bar = 20 µm. ****p < 0.0001 relative to Control (Student t-test). |

GP images of zebrafish kidney at different orientations. To address the photoselectivity of the Laurdan dye, zebrafish larvae at 4 dpf were stained with Laurdan and fixed in 4% PFA. Intensity images of the kidneys were recorded with a 2-photon microscope, then the sample was turned by 90° and intensity images of the same organ were taken again. For analysis, the images were converted to GP images. GP images were pseudo-colored with red indicating ordered membranes with high GP values and blue indicating fluid membranes with low GP values, as per color scale. Here GP values of the whole organ, the apical membranes and the basolateral membranes were compared. ns, not significant. Scale bar = 20 µm. |

Laurdan microscopy for zebrafish larvae. A) Zebrafish larvae were treated with 0 µm (i) 50 µm (ii) or 100 µm (iii) Laurdan at 3 dpf with for 30 min, then washed and grown to 1-month-old fish. Photographs were taken with a standard digital camera. Scale bars = 2 mm. B–C) Comparison of Laurdan GP values of the apical (AM) and basolateral (BM) membranes of gut, kidney and liver of 6 dpf zebrafish larvae that were imaged live (white bars in B) and after fixation with paraformaldehyde (black bars in B). Data are mean and standard deviations of 50 regions of interests obtained in 10 larvae. In (B), ns, not significant, p > 0.05; *p < 0.05; **p < 0.01 between fixed and live larvae. In (C), ****p < 0.0001 between apical (AM) and basolateral (BM) membranes in live and fixed larvae (Student t-test). |
|
Figure S3: GP values of AM and BM of the gut, kidney and liver at 4 dpf. GP values were extracted from GP images for five regions in five larvae corresponding to the apical membranes (AM) in white, and basolateral membranes (BM) in yellow of epithelial cells in the gut, kidney and liver. GP values for each region-of-interest (ROI) in AM and BM and mean ± standard deviation of GP values are listed in table next to the images. Scale bar = 20 µm. 


|

Tissue morphology of gut (A), kidney (B) and liver (C) in sterol 6 dpf zebrafish larvae. Six dpf larvae was left untreated (Control), enriched in 7-ketocholesterol (7KC, 100 µm, 30 min) or depleted of cholesterol with methyl-β-cyclodextrin (mβCD, 2.5 mm, 40 min) as in Figure 3, fixed and stained with antibodies against the tight junction marker ZO-1 (red), WGA (yellow) to mark the cell surface, CTxB (green) to label GM1-rich membranes and DAPI (blue) to visualize cell nuclei. Scale bar in merged images is 20 µm; scale bar in zoomed merged images is 5 µm. |

Junctional integrity of gut, kidney and liver in sterol 6 dpf zebrafish larvae. Six dpf larvae was left untreated (Control), depleted of cholesterol with methyl-ß-cyclodextrin (mβCD, 2.5 mm, 40 min) or enriched in 7-ketocholesterol (7KC, 100 µm, 30 min) as in Figure 3, fixed and stained with phalloidin to label junctional actin cable networks (arrowheads) and apical microvilli (arrows). Lumens are indicated with asterisks. |
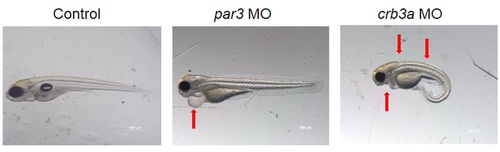
Phenotype of larvae injected with par3 MO and crb3a MO morpholinos. par3 morphants exhibited cardiac edema, a delay in its development, and no swim bladder. crb3a morphants also showed cardiac edema in addition to spinal curvature with no swim bladder. PHENOTYPE:
|