
- Title
-
Generation of an Enhancer-Trapping Vector for Insertional Mutagenesis in Zebrafish
- Authors
- Liu, C., Song, G., Mao, L., Long, Y., Li, Q., Cui, Z.
- Source
- Full text @ PLoS One
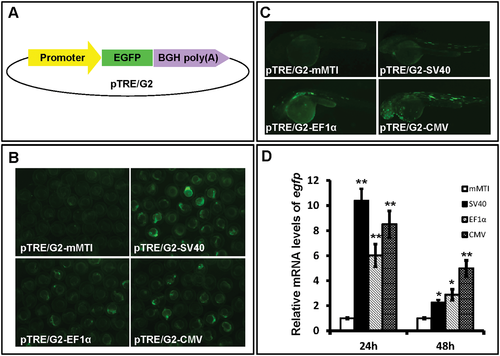
Expression of minimal promoters from mMTI, SV40, EF1α and CMV. (A) The schematic drawing of pTRE/G2 vector used for testing promoter activity. (B and C) Representative images of embryos injected with pTRE/G2 vectors containing mMTI, SV40, EF1α or CMV minimal promoters under a fluorescence microscope at 24 and 48 hpf. (D) Expression of EGFP was detected by qRT-PCR in injected embryos at 24 and 48 hpf. Data were calculated from three independent experiments and given as means ± standard deviation. * and ** indicate p<0.05 and p<0.01 versus the group injected with pTRE/G2-mMTI embryos. |
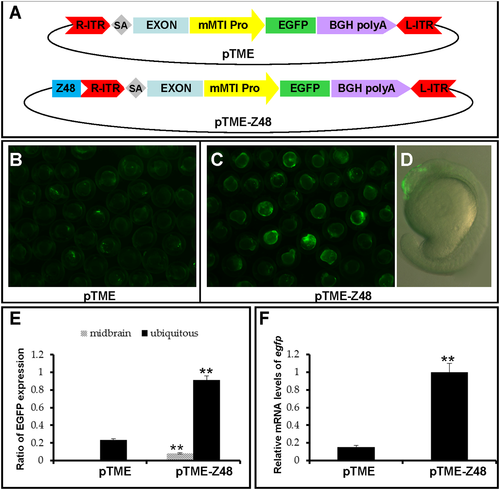
Artificial assays of ET activity of mMTI promoter. (A) ET vector pTME and an artificial ET vector pTME-Z48 in miniTol2 transposons. ITR-R and ITR-L, right and left inverted terminal repeats of miniTol2 transposon; SA, splice acceptor from carp β-actin gene; Exon, exon2 from the carp β-actin gene; mMTI Pro., mMTI minimal promoter; BGH polyA, bovine growth hormone polyadenylation sequence. The Z48 enhancer was subcloned into the pTME vector upstream of ITR-R. (B and C) Zebrafish embryos were injected with pTME or pTME-Z48 at the one-cell stage and images were captured under a fluorescent microscope Zeiss M205 at 20 hpf. (D) The midbrain-specific expression of EGFP in one representative embryo from (C) injected with pTME-Z48 is shown in a merged fashion. (E) The average percentage of embryos with ubiquitous or midbrain specific GFP fluorescence in three independent experiments. Total numbers of embryos injected with pTME or pTME-Z48 were counted at 20 hpf and scored for ubiquitous EGFP expression and specific EGFP expression in the midbrain. (F) qRT-PCR analysis of relative EGFP mRNA levels in injected embryos. Data are given as means ± standard deviation (n = 3). ** indicates P < 0.01 versus the pTME-injected embryos. |
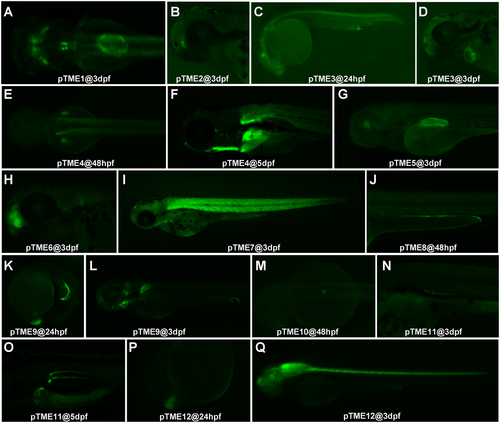
ET lines with different patterns of EGFP expression. (A) Dorsal view of pTME1 embryo at 3 dpf. (B) Lateral view of pTME2 embryo at 3 dpf. (C and D) Lateral view of pTME3 embryos at 24 hpf (C) and 3 dpf (D). (E and F) Dorsal view of pTME4 embryos at 48 hpf (E) and lateral view at 5 dpf (F). (G) Lateral view of pTME5 embryo at 3 dpf. (H) Lateral view of pTME6 embryo at 3 dpf. (I) Lateral view of pTME7 embryo at 3dpf. (J) Lateral view of pTME8 embryo at 48 hpf. (K and L) Lateral view of pTME9 embryos at 24 hpf (K) and 3 dpf (L). (M) Dorsal view of pTME10 embryo at 48 hpf. (N and O) Lateral view of pTME11 embryos at 3 dpf (N) and 5 dpf (O). (P and Q) Lateral view of pTME12 embryos at 24 hpf (P) and 3 dpf (Q). EXPRESSION / LABELING:
|
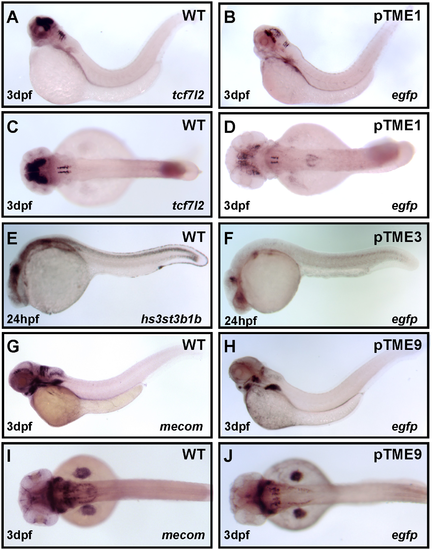
Comparison of EGFP expression patterns in three ET lines with those of corresponding endogenous genes. (A, B, C and D) Wide-type (WT) and pTME1 embryos were collected at 3 dpf and WISH assays were performed with antisense RNA probes for tcf7l2 or egfp, respectively. (E and F) WT and pTME3 embryos were fixed at 24 hpf for WISH assays. WT embryos were detected with probe hs3st3b1b (E) and pTME3 embryos with probe egfp (F). (G, H, I and J) WISH assays for WT or pTME9 embryos at 3 dpf were conducted with antisense RNA probes for mecom or egfp. Embryos were viewed in lateral (A, B, E, F, G and H) and dorsal (C, D, I and J). EXPRESSION / LABELING:
|

One of conserved noncoding elements (CNEs) near the ET insertion site in pTME12 exhibited an enhancer activity. (A) Distribution of CNEs in the region between rhcga and kif7 in zebrafish genome. Genomic sequences between rhcga and kif7 from zebrafish, fugu and medaka were subjected to VISTA browser and four CNEs were predicted in zebrafish genome as indicated (gray and red frame). The location of insertion site is marked with black arrow. (B) Schematic representation of pTMEt vector used for testing enhancer activity. Elements used in this vector are the same as pTME except for a substitution of the mutation cassette with one of CNEs. (C, C', D, D', E and E') Zebrafish embryos injected with pTMEt-CNE2 exhibited transient and specific EGFP expression in the central nervous system at 48 hpf. EGFP expression in embryos from the ET line pTME12 was viewed in lateral (C) and in dorsal (C’) at 48 hpf. Transient EGFP expression in WT embryos injected with pTMEt-CNE2 and embryos were viewed from lateral (D) and dorsal (D’). Embryos injected with pTMEt-CNE2 were prepared for WISH with egfp RNA probes and lateral (E) and dorsal (E’) views of a representative embryo indicate the specific GFP expression in the brain and spinal cord. |
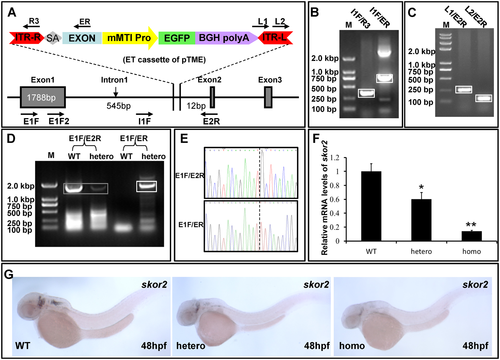
Insertion mutagenesis of gene skor2 in a transgenic fish line. (A) A schematic representation of ET cassette inserted into the intron 1 of skor2 gene. (B and C) Integrity analysis of ET cassette at the integration site by PCR using primers as indicated in (A). Boxed DNA bands (B and C) were separated and sequenced. (D) RT-PCR analysis of endogenous skor2 and fusion transcripts in WT and heterozygous (hetero). Primer pairs E1F/E2R were used for amplification of endogenous skor2 transcripts and E1F/ER for exon1-exon fusion transcripts. Two 1840-bp PCR products (boxed) were amplified with primer pairs E1F/E2R and represent a fragment of endogenous transcripts. A single 1856-bp PCR product (boxed) was amplified from heterozygous cDNA. (E) Sequencing data indicate the E1F/ER PCR product in (D) is a fusion transcript of skor2 exon1 and a partial exon in pTME vector. Dotted line indicates the fusion position. (F) qRT-PCR was performed with primer E1F2/E2R to determine the expression of endogenous skor2 gene in WT, heterozygous (hetero) and homozygous (homo) embryos at 48 hpf. The skor2 expression levels were normalized to the β-actin levels. (G) WISH with skor2 probes to detect the endogenous skor2 mRNA expression in WT, heterozygous and homozygous embryos at 48 hpf. |
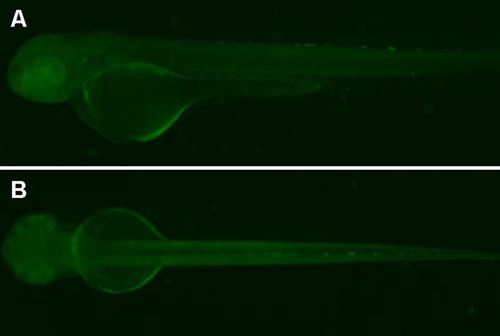
EGFP expression patterns in the fish line with a disrupted expression of skor2 gene. (A and B) Lateral (A) and dorsal (B) view of embryos at 48hpf. |

Unillustrated author statements EXPRESSION / LABELING:
|