
- Title
-
Telomerase Is Essential for Zebrafish Heart Regeneration
- Authors
- Bednarek, D., González-Rosa, J.M., Guzmán-Martínez, G., Gutiérrez-Gutiérrez, Ó., Aguado, T., Sánchez-Ferrer, C., Marques, I.J., Galardi-Castilla, M., de Diego, I., Gómez, M.J., Cortés, A., Zapata, A., Jiménez-Borreguero, L.J., Mercader, N., Flores, I.
- Source
- Full text @ Cell Rep.

Heart Cryoinjury Augments Telomerase Activity and tert Expression Levels (A) Representative telomeric repeat amplification protocol (TRAP) activity in uninjured (UI) hearts and hearts at 1, 3, 4, 7, and 30 days post cryoinjury (dpi) (n = 3/condition and time point). Positive control (C+), iPSCs; negative control (C), tert-/- zebrafish heart; reaction specificity control, uninjured + RNase. LB, lysis buffer. (B and C) Telomerase TRAP activity assay in 6- and 10-month-old zebrafish hearts (n = 4/time point). Data are means ± SEM. ns, not significant (unpaired Student’s t test). (D) Zebrafish tert mRNA expression levels in homeostasis and during regeneration (3 dpi) (n = 4 hearts/condition). CPMs, counts per million. Values are means ± SEM. p < 0.001 (B–H adjusted p value). (E) Representative TRAP assay showing the lack of telomerase activity in tert-/- hearts (n = 3/genotype). (F) Lack of telomerase does not affect heart development and function. There is normal anatomy and function in tert-/- zebrafish hearts. Shown are whole-mount views of dissected adult WT and tert-/- uninjured zebrafish hearts (left) and Masson-Goldner trichrome-stained sagittal sections (center). Five animals were analyzed per genotype. V, ventricle; At, atrium; BA, bulbus arteriosus. Scale bars, 100 µm. (G and H) Echocardiographic evaluation of heart size (ventricular volume (VV) in diastole) (G) and cardiac function (ventricular FVS) (H) in uninjured WT and tert-/- animals. Values for both parameters did not differ between genotypes. Circles and squares show data for individual animals. Horizontal bars represent the mean (unpaired Student’s t test). A total of 17–20 animals were analyzed per genotype. |
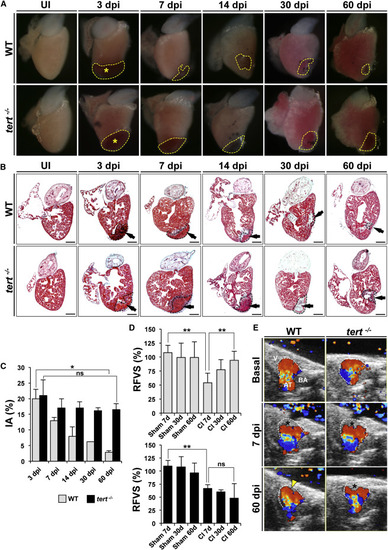
Heart Regeneration Is Inhibited Strongly in tert-/- Animals (A) Whole-mount views of uninjured and cryoinjured WT and tert-/- zebrafish hearts dissected at the indicated times post-injury. Dotted lines outline the injured area. Asterisks mark the initial injury site. (B) Masson-Goldner trichrome staining of sagittal sections of uninjured WT and tert-/- hearts at the indicated days after cryoinjury. Dotted black lines outline the injured area. Arrows mark the initial injury site. Scale bars, 100 µm. (C) Size of the ventricle injury (injured area [IA]) on sagittal heart sections at the indicated times post-injury, presented as the percentage of the total ventricular area. Data are means of at least 4 sections/heart from 3-8 hearts/time point, with the exception of WT 30 dpi, where only one heart was analyzed. Data are means ± SEM. p < 0.05 (Mann-Whitney test). (D) Relative FVS (RFVS) in WT and tert/ zebrafish hearts under the basal condition (sham-operated animals) and at the indicated times post-injury. WT hearts recover ventricular function over time but tert-/- hearts do not. Data are means ± SEM of a pool of 10 animals/condition. p < 0.01 (one-way ANOVA followed by Tukey’s honest significant difference test). (E) Representative Doppler echocardiography images of intracardial blood flow in WT and tert-/- hearts in the absence of injury and at the indicated times post-injury. Asterisks mark the initial injury site. See also Movies S1, S2, S3, S4, S5, and S6. See also Figures S1–S3, and Table S1. |
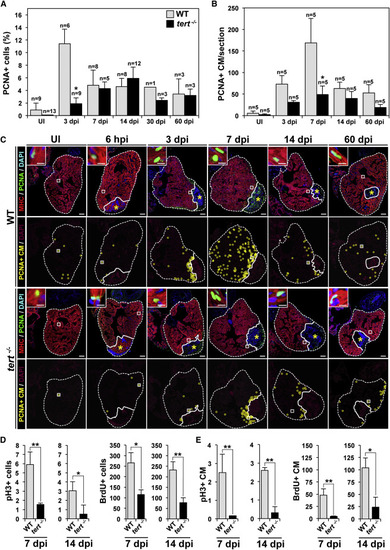
The Absence of Telomerase Severely Affects Cardiomyocyte Proliferation (A and B) Cardiac cells positive for PCNA in UI WT and tert-/- zebrafish hearts and in hearts at the indicated days after cryoinjury. (A) PCNA+ total cardiac cells. (B) PCNA+ cardiomyocytes. Data are means ± SEM of the percentage of PCNA+ cells (A) or number of PCNA+ cardiomyocytes per cardiac ventricle section (at least 3 sections/animal from the indicated number of animals) (B). p < 0.05 compared with WT samples (Mann-Whitney test). (C) WT and tert-/- heart sections immunostained with anti-MHC to mark cardiomyocytes (red) and anti-PCNA to mark cells in S phase (green). Nuclei were counterstained with DAPI (blue). The bottom rows show the location of PCNA+ cardiomyocytes during regeneration (yellow circles). The nuclear area is shown in magenta. Dotted lines outline the ventricle and injured area. Asterisks mark the initial injury site. Insets show high-magnification views of representative PCNA+ cardiomyocytes in the boxed areas. Scale bars, 100 µm (whole-heart views) and 10 µm (magnifications). (D and E) Quantification of pH3+ and BrdU-labeled cardiac cells (D) and cardiomyocytes (E) at 7 and 14 dpi. Data are means ± SEM. p < 0.05, p < 0.01 (unpaired Student’s t test). See also Figures S4 and S5. |
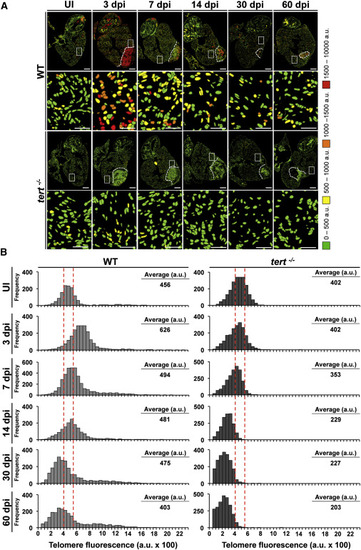
Heart Cryoinjury Induces a Telomerase-Dependent Increase in Telomere Reserves (A) Representative telomap images of WT and tert-/- heart, uninjured (UI) or fixed at different days postinjury [dpi]. Nuclei are assigned a four-color code according to their average telomere fluorescence in a.u. The cells with the longest telomeres are visualized in red, and the cells with the shortest telomeres are presented in green. Dotted lines mark the injured area. The second and fourth rows show higher magnifications of the boxed areas highlighted in the entire heart section images. Scale bars, 100 µm and 10 µm for magnification images. (B) Telomere fluorescence frequency histograms of cardiac WT and tert-/- cells in uninjured hearts and hearts at 3, 7, 14, 30, and 60 days after cryoinjury. Mean telomere fluorescence is indicated in a.u. The injury site was excluded from the analysis. Note the increase in the number of cells with long telomeres at 3 dpi in WT hearts, followed by reestablishment of the initial profile. This response is lacking in tert/ cells, and, at later stages, cells have shorter telomeres than initially. See also Figure S6. |
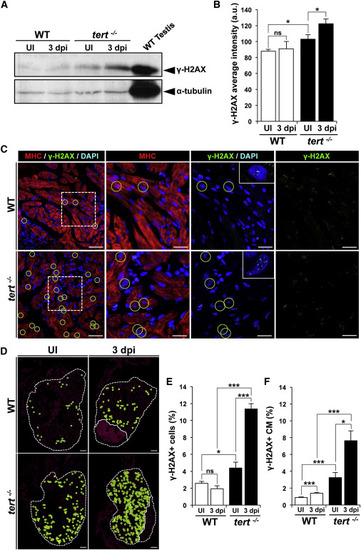
DNA Damage Increases Strongly after Ventricular Cryoinjury in the Absence of Telomerase (A) Representative western blot of γ-H2AX expression in WT and tert-/- hearts without injury and in hearts at 3 dpi. (B) Quantification of western blot signal intensities (n = 9 hearts/condition). Data are means ± SEM. p < 0.05 (Mann-Whitney test). (C) Representative staining of γ-H2AX foci (green) in cardiac cells in uninjured and 3 dpi WT and tert-/- hearts. Cardiomyocytes are immunostained with anti-MHC (red), and nuclei are counterstained with DAPI (blue). Examples of γ-H2AX+ cardiomyocytes are outlined with green circles. Boxed areas are shown at a higher magnification. Scale bars, 20 µm. (D) Distribution of γ-H2AX-positive cardiomyocytes (green circles) in uninjured and 3 dpi WT and tert-/- hearts. The nuclear area is shown in magenta. The ventricle and injured area are outlined by dotted lines. Scale bars, 100 µm. (E and F) Percentages of (E) γ-H2AX-positive cardiac cells and (F) γ-H2AX-positive cardiomyocytes in uninjured and 3 dpi WT and tert-/- hearts. Data are means ± SEM of cells counted on a minimum of 3 sections/heart in four hearts. p < 0.05, p < 0.01, p < 0.001 (Student’s t test). See also Figure S7. |

tert-/- Hearts Acquire a Senescence Phenotype after Ventricular Cryoinjury (A) Whole mounts of uninjured and 3 dpi WT and tert-/- hearts stained for SA β-galactosidase. Scale bars, 100 µm. (B) Cryosections of uninjured, 3 dpi, and 7 dpi WT and tert-/- hearts stained for SA β-galactosidase. Magnified views are shown of the injured area, injury border (B), and remote zone (R). Scale bars, 100 µm (whole heart) and 50 µm (magnified views). |

Inflammatory response in cryoinjured tert-/- zebrafish hearts. (A) RNA expression of neutrophil, macrophage and inflammatory marker genes in wildtype (WT, grey bars) and tert-/- zebrafish hearts (black bars), uninjured or 3 days postinjury (dpi). Injury led to an increase in the expression of the markers analyzed both in WT and tert-/- hearts. Differences between WT and tert-/- zebrafish hearts are non-significant in all cases (B-H adjusted p-value). Data are means ± SEM of values obtained from an RNA-seq experiment of 4 biological replicates, each replicate consisting of 3 pooled hearts. CPM, counts per million; dpi, days postinjury; I, injured; UI, uninjured. (B-G) Immunofluorescence of L-plastin (green) on WT (B,E) and tert-/- (C,F) heart sections and the quantification of L-plastin positive cells at 3 (B-D) and 60 dpi (E-G). DAPI was used to counterstain nuclei (blue). Graphs show means ± SEM L-plastin signal in the injured area (IA) and within 50 µm of the border zone on sections from 3 hearts per condition. The IA is outlined by a dotted line. AT, atrium; a.u. arbitrary units; BA, bulbus arteriosus; dpi, days postinjury; IA, injured area; V, ventricle. Bars, 200 µm. Related to Figure 2. |

Early activation of epicardial and endocardial genes is unaffected in the absence of telomerase. (A) Representative images of aldh1a2 RNA and protein expression detected by in situ hybridization (ISH) and immunohistochemistry (IHC) in endocardium and epicardium at the indicated times post-injury in WT and tert-/- zebrafish hearts. IHC on uninjured heart sections are shown for comparison. A total of n=4 hearts were analyzed per condition, with a minimum of 3 analyzed sections per heart. Asterisks mark the injured region. Boxed areas are shown at higher magnification. At, atrium; BA, bulbus arteriosus; dpi, days postinjury; V, ventricle. Scale bars: 100 µm for general views and 50 µm for zoomed views. (B) RNA expression of endocardial genes (aldh1a2, il11a) and epicardial genes (wt1b, tbx18 and fibronectin) upregulated upon cardiac injury in WT and tert-/- zebrafish hearts. Data are means ± SEM of values obtained from an RNA-seq experiment of 4 biological replicates, each replicate consisting of a pool of 3 hearts. Differences between WT and tert-/- zebrafish hearts are non-significant in all cases (B-H adjusted p-value). CPM, counts per million; dpi, days postinjury; UI, uninjured. Related to Figure 2. |
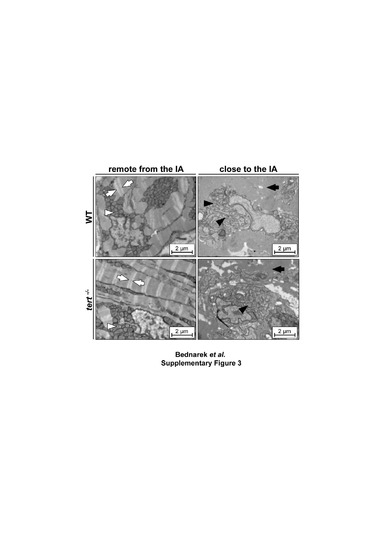
Cardiomyocyte dedifferentiation is unaffected in the absence of telomerase. Transmission electron micrographs of cardiomyocytes at 3 days post injury. (Left) Representative cardiomyocytes away from the injury site in WT and tert-/- animals, showing ordered sarcomeric fibers with visible Z-lines (white arrows) and perinuclear mitochondria with typical structure (white arrowheads). (Right) Representative cardiomyocytes close to the injury site, showing disorganized sarcomeric structure with loss of Z-lines (black arrows) and dysmorphic mitochondria (black arrowheads). IA, injury area; WT, wildtype. Scale bars: 2 µm. Related to Figure 2. |

tert loss of function leads to reduced cardiomyoyte proliferation. (A) Immunofluorescence staining on wildtype (WT) and tert-/- hearts with anti-myosin heavy chain (MHC, red), anti-BrDU (green) and anti-phospho histone 3 (pH3, white). Nuclei are counterstained with DAPI. Boxed areas are shown at higher magnification; yellow circles highlight BrdU/MHC and pH3/MHC double positive cardiomyocytes. Note that fewer pH3 and BrdU-positive cardiomyocytes are found in the tert-/- heart. Scale bars: 100 µm (whole mount views), 10 µm (magnifications). (B) RNA expression of cyclins, cdks, replication licensing factors and processivity factors implicated in a proliferation response in uninjured and 3 dpi WT and tert-/- hearts. Data are means ± SEM of values obtained from an RNA-seq experiment of 4 biological replicates, each replicate consisting of 3 pooled hearts. CPM, counts per million; dpi, days postinjury. *p<0.05, ** p<0.01, *** p<0.001 (Benjamini-Hochberg adjusted p-values). Related to Figure 3. |

tert silencing in the injured hearts inhibits the proliferative response of cardiac cells. (A) tert activity assay in stab-injured hearts cultured for 3 days in the presence of 10 µM gfp vivo Morpholino or tert vivo Morpholino. Data are means ± SD from 2 pools of 3 hearts per condition (p<0.05, unpaired Student’s t-test). A second experiment using 2 additional control and tert vivoMO replicates at 15 µM (3 pooled hearts per replicate) yielded the same result (data not shown). (B) Immunfluorescence analysis of gfp and tert vivoMO-treated hearts. Stab-injured hearts were immunostained for PCNA (green) and myosin heavy chain (MHC, red), and nuclei were counterstained with DAPI (blue). Boxed areas are shown at higher magnification in the lower panels. Bars, 200 µm (whole heart images), 50 µm (zoomed views). (C) Quantification of the percentage of PCNA-positive cells per total cell nuclei in hearts treated with gfp or tert vivoMO. Data are means ± SD from 4-5 hearts per condition (p<0.05, unpaired Student’s t-test). Related to Figure 3. |
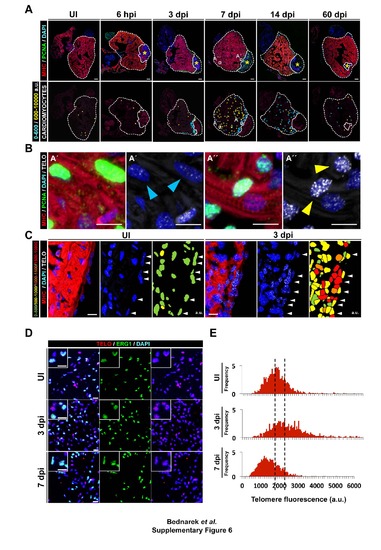
Telomere length dynamics of cardiac cells and location of proliferating WT cardiomyocytes in the non-injured and cryoinjured heart. (A) The top row shows representative sections of zebrafish hearts immunostained for the cardiomyocyte marker MHC (red) and the proliferation marker PCNA (green), with nuclear counterstaining with DAPI (blue). Asterisks mark the injured area. The bottom row shows the locations of proliferating cardiomyocytes. The panels depict proliferating cardiomyocytes with relatively short telomeres (<600 a.u.) in light blue and those with relatively long telomeres (> 600 a.u.) in yellow. (B) Representative proliferating cardiomyocytes located close to the injury site (A′) and in the remote region (A′′). Arrowheads indicate PCNA-positive cardiomyocytes with short (blue arrowhead) or long (yellow arrowhead) telomeres. (C) Telomere length dynamics in the epicardium region of uninjured and 3 dpi WT zebrafish hearts. White arrowheads indicate epicardial cells. (D) Immunostaining of the endocardium (endothelial cell marker erg1; green) combined with Q-FISH detection of telomere length (red) in uninjured, 3 dpi and 7 dpi WT zebrafish hearts. Nuclei are counterstained with DAPI (blue). (E) Representative histograms showing the frequency of telomere fluorescence in arbitrary units (a.u.) in endocardial cells upon cryoinjury. a.u. arbitrary units; dpi, days postinjury; hpi; hours postinjury; PCNA, proliferating nuclear cell antigen; WT, wildtype. Scale bars: 100 µm for whole heart sections and 10 µm for zooms. Related to Figure 4 and 5. |

Cardiac cells with accumulated DNA damage are less prone to proliferate. (A) Immunofluorescence staining on a WT and a tert-/- heart section with anti-BrdU (red) and anti-γH2AX (green). Nuclei are counterstained with DAPI (blue). (A1-A4) Boxed areas in the whole-mount heart views of WT (A1,A2) and tert-/- (A3,A4) are shown at high magnification in the right panels to exemplify individual BrDU-positive cells. Scale bars: 100 µm (whole mount views), 10 µm (magnifications). (B) Quantification of cells double positive for BrDU and γH2AX. Data are means ± SEM of 4 sections/heart from a total of 3 hearts per condition (p=0.106, unpaired Student’s t-test). ns, not significant. Related to Figure 6. |