
- Title
-
Chamber identity programs drive early functional partitioning of the heart
- Authors
- Mosimann, C., Panáková, D., Werdich, A.A., Musso, G., Burger, A., Lawson, K.L., Carr, L.A., Nevis, K.R., Sabeh, M.K., Zhou, Y., Davidson, A.J., DiBiase, A., Burns, C.E., Burns, C.G., MacRae, C.A., Zon, L.I.
- Source
- Full text @ Nat. Commun.
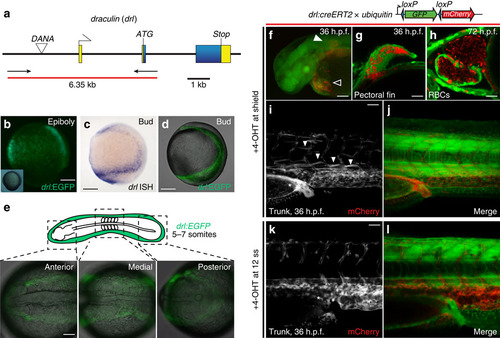
drl transgene reporter expression in the early lateral plate mesoderm and cardiovascular development. (a) The zebrafish draculin (drl) locus; blue depicts coding exons (with ATG and Stop codons), yellow are untranslated regions, a DANA retro-transposon is located in the upstream region, arrows and red bar indicate PCR product used for cloning the regulatory sequence. (b) drl:EGFP reporter expression during gastrulation (80% epiboly, inset shows the embryo in bright-field view), dorsal to the right; scale bar, 100 µm; note the scattered band of cells that form the precursors of the lateral plate mesoderm. (c,d) Bud stage embryos probed for endogenous drl (c, mRNA in situ hybridization, ISH) versus drl:EGFP (d, composite bright-field and EGFP confocal stack image) depicting the continuous lateral plate mesoderm; anterior to the top, posterior to the bottom and dorsal to the right; scale bar, 100 µm. (e) EGFP fluorescence from homozygous drl:EGFP transgenic zebrafish; 5–7 somite stage view of the converging lateral plate mesoderm; scale bar, 100 µm. (f–l) Genetic lineage tracing using drl:creERT2 × ubi:Switch (schematic on top), 4-OHT-induced at shield stage, labels the lateral plate mesoderm descendants at 36 h.p.f., including cardiac (outlined arrowhead in f; scale bar, 250 µm), pectoral fin mesoderm (solid arrowhead in f,g; scale bar, 50 µm), red blood cells (RBCs, h; scale bar, 50 µm), kidney (asterisks in i,j; scale bar, 50 µm), plus vasculature and scattered superficial trunk muscle cells (solid arrowheads in i). (k,l) 4-OHT induction at 12 somite stage and imaged at 36 h.p.f. refines tracing exclusively to the circulatory system and blood, note absence of kidney tracing (asterisks in k); scale bar, 50 µm. |
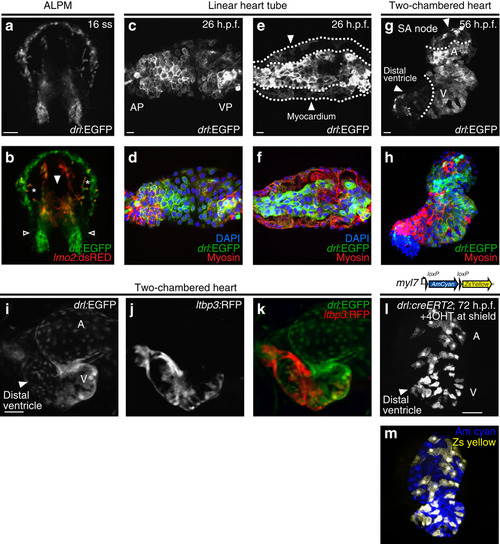
drl transgenic reporters track cardiac development and distinguish FHF from SHF myocardium. (a,b) Confocal projection of the anterior lateral plate mesoderm (ALPM) with hatching gland most anteriorly at 16 somite stage (ss) marked by drl:EGFP, dorsal view (a, green in b) and lmo2:dsRED2 (endothelial and haematopoietic precursors in red, b); asterisks in b indicate migrating myeloid precursors, solid arrowhead indicates merging endocardium precursors, and open arrowheads indicate positions of presumptive myocardium precursors; anterior to the top and posterior to the bottom; scale bar, 100 µm. (c–f) Confocal projections of the linear heart tube at 26 h.p.f., anterior to the left, arterial pole (AP) and venous pole (VP) indicated, (c,d) top-down 2-µm projection, (e,f) transversal optical 2-µm section through heart tube. drl expression (drl:EGFP counter-stained with anti-GFP) in both the central endocardium and the myocardium (counter stained with anti-myosin/MF20 in red, and 4,6-diamidino-2-phenylindole (DAPI) in blue for nuclei in d,f; scale bar, 10 µm. (g,h) 56 h.p.f. two-chambered hearts transgenic for drl:EGFP top-down 2-µm confocal projection counter stained for anti-GFP (g,h), anti-myosin/MF20 in red, DAPI in blue for nuclei in h. EGFP is expressed in outer ventricular curvature and part of atria, with dotted lines indicating the margins of expression domains, the solid arrowhead point to drl:EGFP-negative regions at sinoatrial node (SA) and distal ventricle including outflow tract in g; scale bar, 10 µm. (i–k) Ventral view of a two-chambered heart from a drl:EGFP; ltbp3:TagRFP2Acre double-transgenic embryo at 72 h.p.f.; at this stage, drl:EGFP-positive FHF-derived cardiac cells (i, green in k) comprise central portion of the cardiac tube, while the SHF-derived distal ventricular cardiomyocytes population (arrowhead in i) is labelled by the ltbp3:TagRFP2Acre transgene (j, red in k); scale bar, 50 µm. (l,m) drl:creERT2 × myl7:loxP-Amcyan-loxP-ZsYellow (schematic) induced at shield stage labels all myocardial descendants at 72 h.p.f. including the outflow tract cardiomyocytes in the distal ventricle (arrowhead, l); scale bar, 50 µm. Atrium (A) and ventricle (V) labelled in g,i,l. |
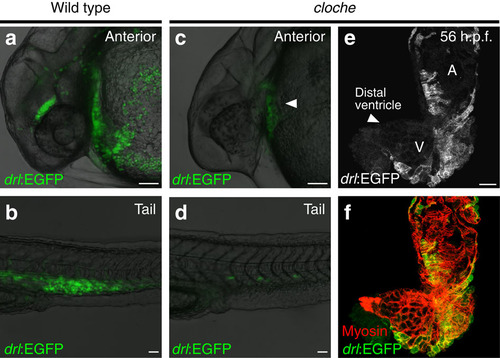
Lack of endocardial signals does not affect integration of FHF with SHF. (a,b) Anterior (a) and tail region (b) expression of drl:EGFP in wild-type zebrafish at 24–28 h.p.f., scale bar, 50 µm; note the circulating red blood cells. (c,d) Anterior (c) and tail region (d) drl:EGFP expression at 24–28 h.p.f. in the recessive zebrafish mutant cloche, which lacks all endothelial and haematopoietic lineages; scale bar, 50 µm; note the formation of linear heart tube in cloche (solid arrowhead in c and residual angioblasts in the tail (d). (e,f) Top-down 2-µm confocal projection of 56 h.p.f. cloche mutant heart, drl:EGFP expression counter stained with anti-GFP (e, green in f) and cardiomyocytes stained with myosin/MF20 (red in f); scale bar, 50 µm; note how despite missing endocardium the heart features both demarcated FHF and SHF myocardium, solid arrowhead in e indicates the distal ventricle region. Atrium (A) and ventricle (V) labelled in e. |
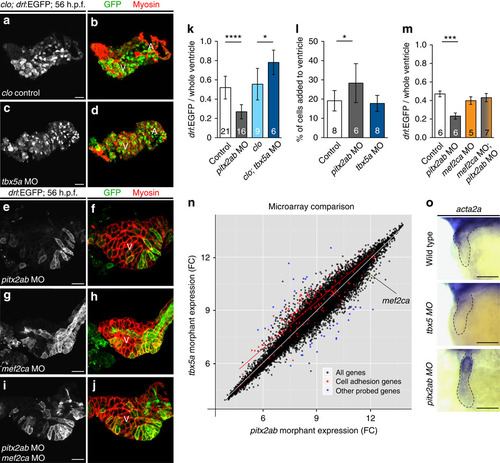
tbx5a and pitx2ab affect the relative contribution of FHF versus SHF to the heart tube. (a–j) Top-down 2-µm confocal sections through zebrafish 54–56 h.p.f. hearts; scale bar, 20 µm. (a–d) Hearts mutant for cloche (clo) to enable imaging of myocardium without endocardial and erythrocyte signal in drl:EGFP transgenics, stained for EGFP expression from drl:EGFP (green, monochrome channel image in right column) and myosin/MF20 (red); (a,b) cloche-only control, (c,d) morpholino knockdown of tbx5a leads to expansion of FHF. (e,f) Loss of pitx2ab results in diminishing of FHF and expansion of SHF. (g–j) Genetic interplay of mef2ca with pitx2ab on FHF versus SHF contribution in wild-type hearts. (g,h) Loss of mef2ca leads to only mild reduction of FHF contribution. (i,j) Concomitant loss of mef2ca and pitx2ab reverts the pitx2ab morpholino (MO)-mediated impact on FHF formation. (k) Graph displaying the ratio of FHF area labelled by drl:EGFP expression to the whole ventricular area determined by anti-myosin staining in hearts from experiments represented in a–f. (l) Graph showing percentage of newly added cardiomyocytes to the ventricle after photoconversion of myl7:nlsKikGR at 27 h.p.f. and imaged at 56 h.p.f. (see also Supplementary Fig. 6). (m) Graph showing the restoration of the FHF area labelled by drl:EGFP expression to the whole ventricular area determined by anti-myosin staining in hearts with combined loss of pitx2ab and mef2ca comparing with the single morphant or control hearts. Error bars in k–m=s.d., asterisks indicate significance, significance tested by two-tailed unpaired t-test, P<0.05. (n) At 54–56 hpf, whole-embryo microarray comparison of tbx5a versus pitx2ab knockdown reveals cell adhesion genes significantly deregulated (red dots); note the upregulation of the SHF regulator mef2ca on pitx2ab knockdown (orange dot). (o) mRNA in situ hybridization of acta2a as representative deregulated gene at 52–56 h.p.f.; closeups of heart regions, anterior to the left, in indicated conditions, dotted outlines indicate heart tube; scale bar, 100 µm (see alsoSupplementary Fig. 8 for more examples). |
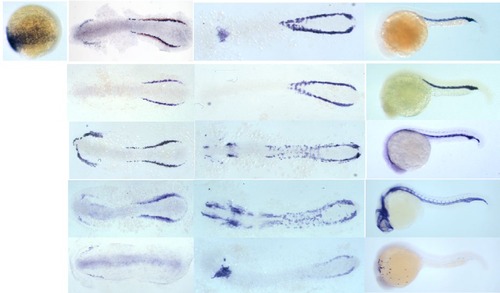
Zebrafish drl is transcribed earlier than traditional blood markers, labels the forming lateral mesoderm, and subsequently restricts expression into cardiovascular and hematopoietic lineages. Panel of classic marker genes expressed in hematopoietic populations, scale bars = 200 µm; the epiboly-stage embryo is animal to the top, ventral (V) to the right, dorsal (D) to the left; later stages (flat mounts and 24 hpf whole mounts) are anterior (A) to the left, posterior (P) to the right; note prominent expression of all genes in the Intermediate Cell Mass (ICM) at 24 hpf, except the myeloid marker pu.1 which is expressed in the anterior myeloid precursors. |
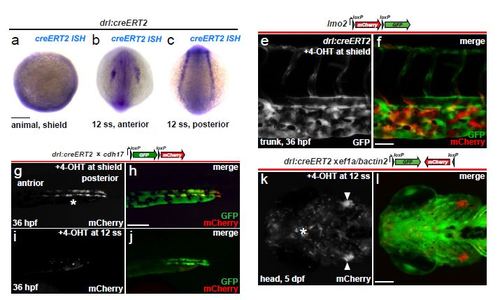
drl reporter expression refines to anterior and posterior cardiovascular lineages over time. (a-c) mRNA in situ hybridization (ISH) for creERT2 in drl:creERT2 embryos shows expression at shield stage (a, animal pole view, ventral on top) at the embryo margin, and at 12 somite stage (b, c) shows the separation of drl reporter expression into anterior and posterior lateral mesoderm; scale bar = 100 µm (e, f) Vascular lineage tracing confirmed using drl:creERT2 crossed to the endothelial-specific loxP reporter lmo2:Switch (schematic) and 4- OHT-induced at shield stage, tracing (GFP signal, green) shown in the trunk at 36 hpf; scale bar = 50 µm. (g-j) Transgenic zebrafish carrying drl:creERT2 crossed to cdh17:loxP-GFP-loxP-mCherry (schematic) were induced with 4-OHT at shield or 12 somite stage; mCherry expression in the renal tubules reveals drl expression in their precursors during gastrulation (g, h), but not at later stages of somitogenesis (i, j); scale bar = 100 µm. (k, l) Definitive hematopoietic lineages descend from drl-expressing cells at 12 ss, as shown in a 5-day larva with tracing to the developing bilateral thymus (arrowheads, k) and tissue-infiltrating leukocytes (asterisks, k) using the ef1a/beta-actin2-based FlEx reporter line (schematic); scale bar = 100 µm. |
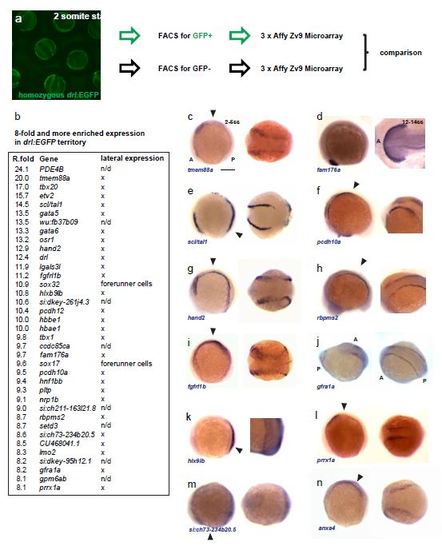
The transcriptome of the drl-positive lateral mesoderm at the beginning of segmentation. (a), schematic of the performed Affymetrix Zv9 microarray experiment; 2 somite stage drl:EGFP homozygous embryos were collected, dissociated, their EGFP-positive and –negative cell populations separated by FACS, the isolated RNA from both populations was subjected to microarray analysis, and the resulting gene expression lists from both populations compared. This resulted in a list of genes that are preferentially expressed in the drl-positive lateral territory. (b), excerpt of the enriched gene list (8-fold or higher), including expression analysis by RNA ISH. (c-n), validation of lateral expression by mRNA ISH for selected candidates from the microarray analysis; for each gene, a lateral view (left, anterior (A) to the left, posterior (P) to the right) and detail view (right, point of view shown by arrow head in lateral view) is shown for 2-5 ss embryos if not depicted otherwise; scale bar = 100 µm. |
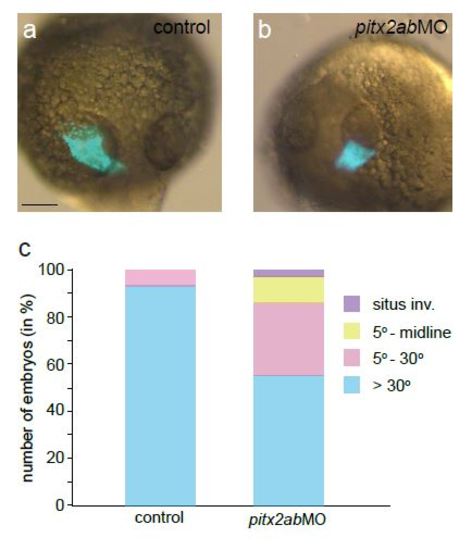
Validation of morpholino-mediated pitx2ab knockdown. Scale bar = 100 µm. (a-c) 24 hpf heart tube positioning in wildtype control (a) shows normal left tilt of the heart tube referred to as jog, while pitx2ab morphants produce random jog (b shown to the right, c statistical representation of phenotype distribution). |
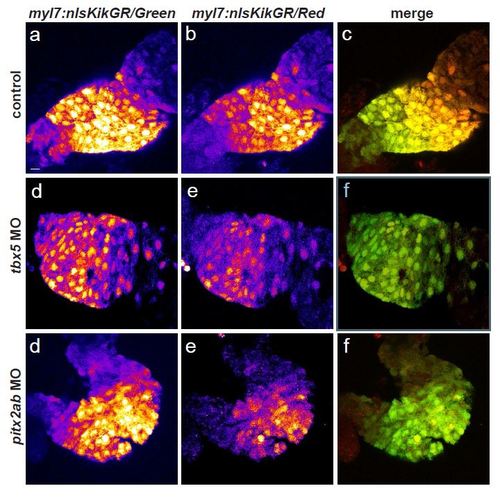
Impact of tbx5a and pitx2ab knockdown on SHF addition to the FHF. Scale bar = 10 µm. (a-i) Photoconversion-mediated lineage tracing of the SHF cardiomyocytes addition to the linear heart tube. Photoconversion of cardiomyocyte-specific Tg(myl7:nlsKikGR) was performed at 365 nm for 2 minutes at 27 hpf and the hearts imaged at 56 hpf; the total conversion to RFP was visually confirmed. a, d, g, shows the green channel, b, e, h, shows the red channel, merge is shown in c, f, i. All GFP-positive nuclei are the newly added cardiomyocytes after 27hpf, RFP-labeled nuclei represents all cardiomyocytes of the linear heart tube prior to photoconversion, yellow in merge (c, f, i). a-c, control hearts, d-f, hearts from tbx5a morphants show mild decrease in newly added cardiomyocytes, g-i, hearts from pitx2ab morphants display increase in cardiomyocyte recruitment. |
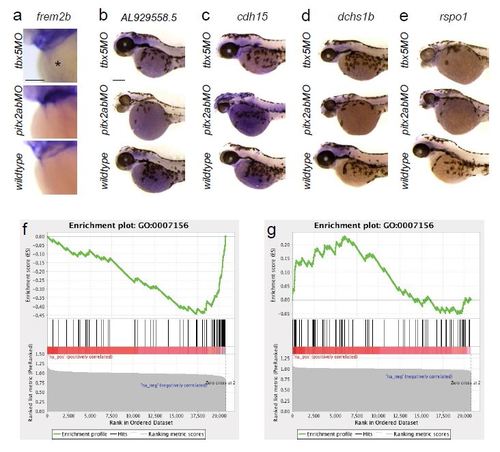
Microarray candidates and GSEA from tbx5a versus pitx2ab morphant analysis. (a-e) mRNA in situ hybridization of genes that are significantly de-regulated in tbx5a versus pitx2ab knockdown conditions; images show head portions of zebrafish embryos at 52-56hpf, anterior to the left; scale bars = 100 µm. (f, g) Analysis of transcriptional profiling results; Gene Set Enrichment Analysis (GSEA) was run using gene lists pre-ranked based on transcriptional changes following knockdown of either pitx2ab or tbx5a (see Methods). Genes annotated as being involved in ‘homophilic cell adhesion’ (GO:0007156) were found to be significantly down-regulated in pitx2ab (f) morphants, and up-regulated in tbx5a (g) morphants (q < 0.05). Within each panel, the enrichment score (ES; upper plot) is a running sum statistic, wherein positive deviation from 0 indicates enrichment for a given gene set at the top of the ranked list, and negative deviation indicates enrichment at the bottom. Barcoding (middle plot) indicates observation of genes from the tested gene set at the indicated position of the ranked list. The bottom plot shows the value of the ranking metric throughout the ordered set. |