
- Title
-
Osteoblast de- and redifferentiation is controlled by a dynamic response to retinoic acid during zebrafish fin regeneration
- Authors
- Blum, N., Begemann, G.
- Source
- Full text @ Development
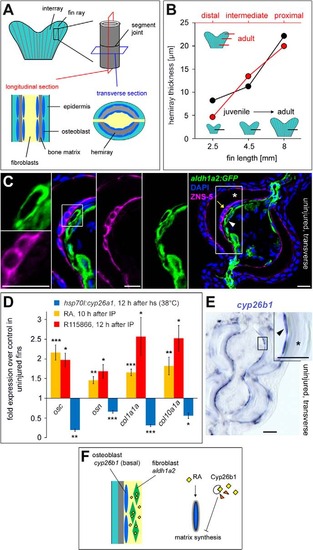
Bone matrix synthesis in the uninjured fin is controlled by RA production and degradation. (A) Overview of relevant structures and tissue types of a fin ray. (B) Mean hemiray thickness at different positions along the proximodistal axis in adult fish (red) and at an intermediate position in fins of different lengths (black) show that hemirays are thicker in older fish (longer fin) and at more proximal positions. (C) IHC for ZNS-5 and GFP in aldh1a2:gfp fish in the uninjured fin reveals aldh1a2 expression in fibroblasts (arrowhead) adjacent to osteoblasts (arrow). Asterisk indicates bone matrix. (D) RA and R115866 injections upregulate expression of bone matrix genes. Conversely, inhibition of RA signaling in hsp70I:cyp26a1 fish downregulates expression (qPCR analysis). (E) ISH demonstrates cyp26b1 expression in osteoblasts (arrowhead). Asterisk indicates bone matrix. (F) Model of bone matrix synthesis regulation by RA synthesis and degradation in the uninjured fin. Data are represented as mean±s.e.m. *P<0.05, **P<0.01, ***P<0.001. Scale bars: 10µm in C; 20µm in E. h, hours; hs, heat shock. |

Stump osteoblasts upregulate cyp26b1 expression. (A) Fin amputation induces upregulation of aldh1a2 and cyp26b1 expression. qPCR analysis. P<0.05 unless noted otherwise. (B) IHC for ZNS-5 and GFP in aldh1a2:gfp fish at 24hpa reveals aldh1a2 expression in fibroblasts (arrowhead). (C) WISH indicates upregulated cyp26b1 expression within one segment length proximal to the amputation plane at 18hpa. Longitudinal section on WISH shows upregulated cyp26b1 expression in single osteoblasts (arrowhead). Scale bars: 20µm in B and C (section); 50µm in C WISH. Dashed lines indicate amputation planes. |
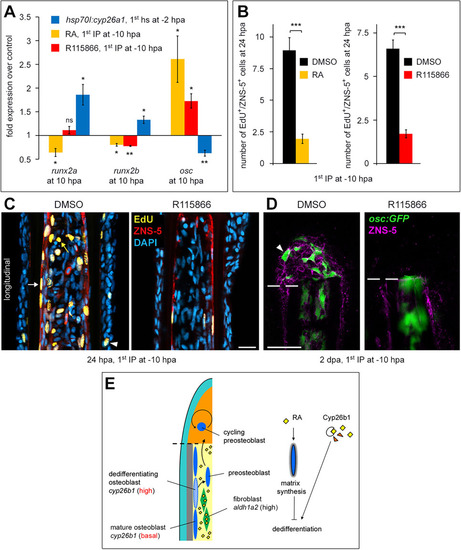
Osteoblast dedifferentiation requires RA inactivation by Cyp26b1. RA and R115866 injections starting at 10hpa block osteoblast dedifferentiation. Inhibition of RA signaling in hsp70I:cyp26a1 fish positively affects dedifferentiation. (A) qPCR analysis of osteoblast markers at 10 and/or 24hpa. (B) EdU+/ZNS-5+ cells per section at 24hpa. (C) IHC for ZNS-5 combined with EdU labeling. Images show the stump region adjacent to the amputation plane. White arrow indicates EdU+/ZNS-5+ cell, yellow arrow denotes EdU+ fibroblast, arrowhead indicates EdU+ epidermal cell. (D) IHC for ZNS-5 and GFP in osc:gfp fish demonstrates absence of preosteoblasts in the blastema of R115866-treated fish at 2dpa. Arrowhead indicates GFP+ preosteoblast in control fish. (E) Model for Cyp26b1 function in osteoblast dedifferentiation. Data are represented as mean±s.e.m. *P<0.05, **P<0.01, ***P<0.001. ns, not significant. Scale bars: 20µm in C; 100µm in D. Dashed lines indicate amputation planes. hs, heat shock. |
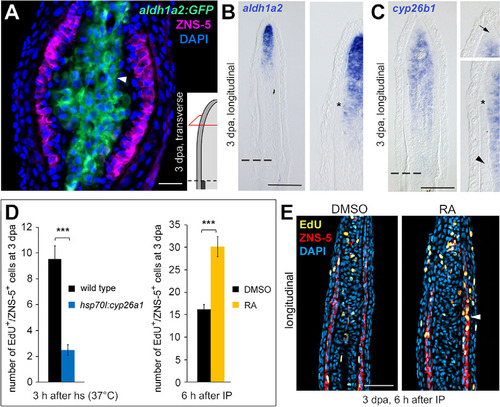
RA signaling promotes osteoblast proliferation. (A) IHC for ZNS-5 and GFP in aldh1a2:gfp fish at 3dpa reveals aldh1a2 expression in fibroblast-derived blastema cells (arrowhead). (B) ISH for aldh1a2 at 3dpa shows that expression is strongest in fibroblast-derived cells in the distal blastema but weak expression reaches far proximally. Asterisk indicates distal leading edge of preosteoblasts. (C) ISH for cyp26b1 at 3dpa demonstrates expression in fibroblast-derived cells of the proximal medial blastema. Note absence of expression in the distal blastema (arrow) and in osteoblasts. Asterisk indicates distal leading edge of preosteoblasts, arrowhead denotes redifferentiated osteoblasts. (D,E) Inhibition of RA signaling in hsp70I:cyp26a1 fish at 3dpa downregulates osteoblast proliferation. RA injection causes an increase in osteoblast proliferation at 6h after IP. (D) EdU+/ZNS-5+ cells per section at 3dpa. (E) IHC for ZNS-5 combined with EdU labeling. Arrowhead indicates EdU+/ZNS-5+ cell. Data are represented as mean±s.e.m. ***P<0.001. Dashed lines indicate amputation planes. Scale bars: 20µm in A; 100µm in B,C,E. h, hours; hs, heat shock. |
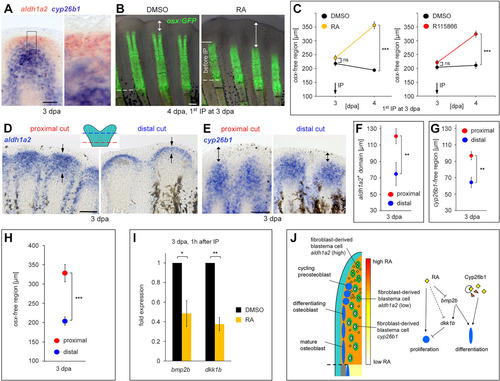
RA signaling keeps preosteoblasts in an undifferentiated state. (A) Distal blastema cells express aldh1a2 but not cyp26b1. Double WISH at 3dpa. (B,C) RA and R115866 injections at 3dpa block preosteoblast differentiation. (B) Live images of osx:gfp fish at 4dpa demonstrate an expanded distal osx-free region (doubled-headed arrow) one day after RA injection. (C) Length of the osx-free domain. (D-H) aldh1a2 expression (D,F), the distal cyp26b1-free domain (E,G) and the osx-free domain (H) extend further proximally in regenerates that had been amputated at a more proximal level. (D) WISH for aldh1a2 at 3dpa. Arrows indicate expression boundaries. (E) WISH for cyp26b1. Double-headed arrows indicate length of the cyp26b1-free region. (F-H) Length of the expression domain or of the distal expression-free region. (I) Injection of RA at 3dpa downregulates bmp2b and dkk1b expression (qPCR analysis). (J) Model for regulation of preosteoblast differentiation by RA signaling. Data are represented as mean±s.e.m. *P<0.05, **P<0.01, ***P<0.001. Dashed lines indicate amputation planes. Scale bars: 100µm. h, hours. |
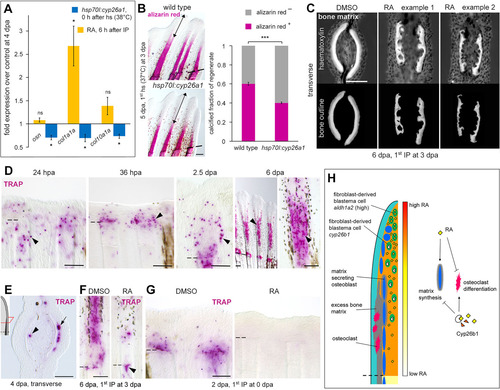
RA signaling promotes bone matrix synthesis while inhibiting degradation. (A) qPCR analysis. Inhibition of RA signaling in hsp70I:cyp26a1 fish at 4dpa causes downregulation of bone matrix genes. Conversely, RA injections barely affect expression. (B) Downregulation of RA signaling in hsp70I:cyp26a1 fish between 3 and 5dpa results in an enlarged noncalcified (Alizarin Red–) distal region (double-headed arrow) at 5dpa. (C) RA injections starting at 3dpa result in regeneration of irregularly shaped hemirays at 6dpa. Hematoxylin staining. Lower panel shows hemiray outlines. (D,E) TRAP staining demonstrates presence of osteoclasts (arrowheads in D) at the wound site, in the early blastema and at the inner (arrowhead in E) and outer surface (arrow in E) of newly formed bone during regenerative outgrowth. (F) RA injections starting at 3dpa result in fewer TRAP+ cells in the regenerate but not at the wound site (arrowhead) at 6dpa. (G) RA injections starting at 0hpa result in absence of TRAP+ cells at the wound site and in the early blastema. (H) Model for RA signaling function in bone matrix synthesis and degradation. Data are represented as mean±s.e.m. *P<0.05, ***P<0.01. ns, not significant. Dashed lines indicate amputation planes. Scale bars: 100µm. |
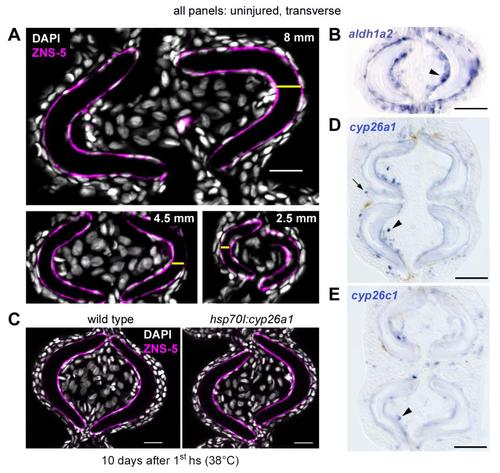
Hemiray thickness increases during fin growth; RA signaling is not required for osteoblast survival. (A) Sections of uninjured fins of different fin lengths reveal correlation between fin length and hemiray thickness. Fin lengths: 8, 4.5 and 2.5 mm. Yellow bars: Hemiray thickness. (B) ISH demonstrates expression of aldh1a2 in proximity to hemirays (arrowhead). (C) Inhibition of RA signaling does not interfere with survival of mature osteoblasts. IHC for ZNS-5 demonstrates a similar number of osteoblasts in wild type and hsp70I:cyp26a1 fish upon 10 days of heat-shock treatment. (D and E) ISH demonstrates expression of cyp26a1 (D) and cyp26c1 (E) in single epidermal (arrow) and mesenchymal (arrowhead) cells in uninjured fins. Scale bars: 20 µm in A, C; 50 µm in B, D and E. hs, heat-shock. |