
- Title
-
A TALEN-Exon Skipping Design for a Bethlem Myopathy Model in Zebrafish
- Authors
- Radev, Z., Hermel, J.M., Elipot, Y., Bretaud, S., Arnould, S., Duchateau, P., Ruggiero, F., Joly, J.S., Sohm, F.
- Source
- Full text @ PLoS One
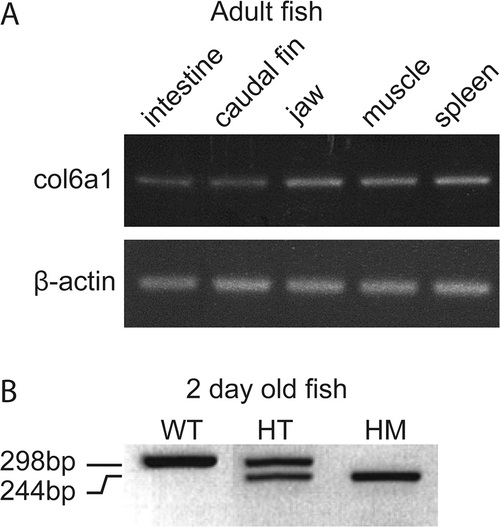
Validation of the presence of col6a1 mRNA by RT-PCR at different developmental stages in different organs of zebrafish. (A) Confirmation of the presence of col6a1 mRNA in different organs of adult WT zebrafish: col6a1 mRNA is detected in the electrophoregram of organs from adult fish as indicated at the top of the panel. β-actin is used as internal control. (B) Confirmation of the presence of two forms of col6a1 mRNA in wild-type (WT) and mutant (presenting exon 14 skipping) zebrafish embryos at 2 dpf from col6a1ama605003 line. WT fish express only the wild type allele (298 bp); heterozyogous mutant (HT) carry both wild type and mutated allele (244 bp) and homozygous fish (HM) express only the exon-skipped form. |
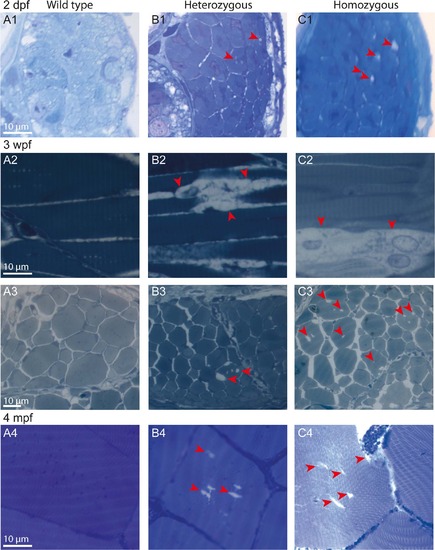
Age-dependent progressive disorganization of muscle fibers of col6a1ama605003 mutants. Light photomicrographs of Richardson’s stained semi-thin 1-µm sections from wild type (WT, A1-4), heterozygous (HT, B1-4) and homozygous (HM, C1-4) col6a1ama605003 mutants at 2 days, 3 weeks and 4 months post-fertilization (2 dpf, 3wpf, 4 mpf, respectively). Right from 2 dpf in HT (B1) as in HM (C1) mutants, we observed abnormal vacuoles (red arrowheads) in the centre of some of the muscle fibers. Muscle fibers adjacent to abnormal ones remained similar to the ones WT (A1). At 3 wpf and at 4 mpf, in HT (B2-4) as in HM (C2-4), the number and the size of abnormal vacuoles in myofibers varied from one area to another. Abnormal myofibers with vacuoles were scattered among unaffected myofibers identical to those observed in WT (A2-4). In sagittal sections of muscle from 3 wpf HT we observed breaks in fiber tethering (B2, red arrowhead) or cell in advanced degradation (C2, red arrowheads). Sections were cut according to transversal plane, except A2, B2, and C2 which were sagittal sections. Scale bars, 10 µm. |

At 5 mpf, in col6a1ama605003 mutants muscles, the number of nuclei was increased additionally HM muscle showed fibrosis. Light photomicrograph of 5 µm-thick paraffin section of trunk muscle of 5 mpf wild type (WT, A, D), heterozygous (HT, B, E) and homozygous (HM, C, F) col6a1ama605003 mutants. The section were cut according to transversal plane and stained with hematoxylin-eosin-safran (A-C) or with Masson’s trichrome (D-F) colorations. We observed a slight increase in nuclei in the fibrous septa of col6a1ama605003 HT (B) and numerous nuclei in HM (C, arrows). Additionally, we observed unidentified amorphous material only in HM (C, arrowheads), and a figure of putative fibrosis (C, star). The Masson’s trichrome confirmed the increasing number of nuclei (violet) from HT (E) to HM (F) as compared to WT (D). This staining also confirmed the presence of large collagen-rich areas most probably marking fibrosis (star, F) that was absent in WT (D) and HT (E). Scale bars 25µm. PHENOTYPE:
|
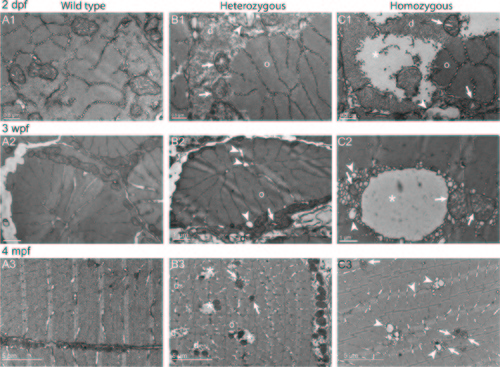
Disorganized Cohnheim’s fields, swollen reticulum and altered mitochondria in col6a1ama605003 mutant fish muscle. TEM pictures of transversal sections of muscle from wild type (WT, A1-3) and col6a1ama605003 heterozygous (HT, B1-3) and homozygous (HM, C1-3) mutants at 2 dpf, 3 wpf and 4 mpf. At 2dpf (A1, B1, C1), 3 wpf (A2, B2, C2) and 4 mpf (A3, B3, C3) in HT and HM mutants, we observed in a few muscle fibers, abnormal mitochondria with areas of the matrix devoid of electron dense material (B1-3, C1-3, arrows). In these myofibers, the abnormal mitochondria were often located in close contact with enlarged sarcoplasmic reticulum (B1-2, C1-3, arrowheads). The altered mitochondria often marked the limit between crystal-like organized (o) Cohnheim’s field and pathologic disorganized (d) myofibrils (B1-3, C1-2). In HM (C1), some fibers appeared more affected than in HT, with drastically disorganized (d) areas separated from organized myofibrils (o) with mitochondria having swollen cristae (C1-3, arrows). The sarcoplasm area of the more affected fibers appeared devoid of material (B3, C1-2, asterisks). (B3) In a few muscle fibers of HM, the reticulum appeared drastically dilated (asterisk) with numerous blebs or autophagic vacuoles localized nearby or within myofibrillar disarray foci (C2) that were also in close contact with mitochondria with enlarged cristae (C2-3, arrows). None abnormal mitochondrion, myofibril disorganization or enlarged reticulum was seen in WT (A1-3). |

Misaligned sarcomeres in col6a1ama605003 mutant fish muscle. TEM pictures of sagittal section of muscle from wild type (WT, A1-3) and col6a1ama605003 heterozygous (HT, B1-3) and homozygous (HM, C1-3) mutants at 2 dpf (A1, B1, C1), 3 wpf (A2, B2, C2) and 4 mpf (A3, B3, C3). As shown in Fig 7 (transversal sections), we observed a swelling of the sarcoplasmic reticulum (B, C, arrowheads), the presence of abnormal mitochondria (B, C, arrows) and vacuoles with membrane blebbing of possibly autophagic nature (B and C, asterisks) in HT and HM mutants at all three ages. In the same myofibre, we also observed disorganized (d) regions amongst still well-organized (o) myofibrils. In sagittal section of HT (B) and HM (C) mutants muscles, the position of the Z-discs and M-bands revealed a conspicuous misalignment of adjacent sarcomeres (white lines). Finally, in HM at 3wpf and 4 mpf (C2-3), the actin filaments in some sarcomeres appeared detached from the Z-line where the vacuole/autophagic vesicles were present (asterisks). No ultrastructural abnormalities as the ones described above were seen in WT (A1-3). |
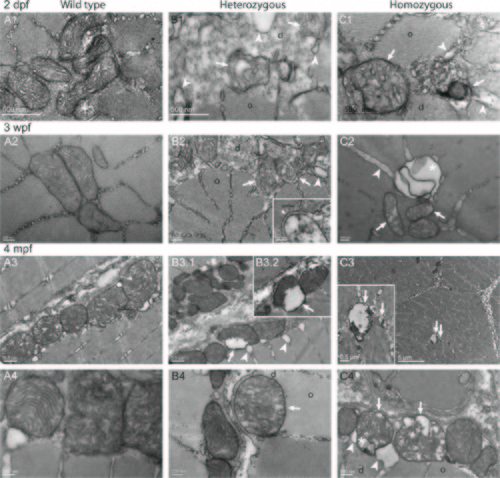
Altered ultrastructure of mitochondria in col6a1ama605003 mutant fish myofibers. TEM pictures of sagittal sections of muscles from wild type (WT, A1-4), heterozygous (HT, B1-4) and homozygous (HM, C1-4) col6a1ama605003 mutants, at 2 dpf (A1, B1, C1), 3 wpf (A2, B2, C2), and 4 mpf (A3-4, B3-4, C3-4). In WT, the mitochondria constantly exhibited a dense and well-delineated lamination of the inner membrane and a well-defined outer membrane (A), attesting of the good quality of the fixation-inclusion procedures. In HT and HM muscles, the morphology of mitochondria was diversiform. Similarly to observations in Figs 7 and 8, some mitochondria presented a matrix partly cleared, or even devoid, of electron dense material (B, C arrow) and with severely dilated external membrane detached from the inner condensed membrane (B2-3, C3-4, arrows). These abnormalities were often associated with figures of vacuole/autophagic vesicles (C2, C4, asterisk). In the same area of HT or HM sections, we often observed a normal mitochondrion close to another one exhibiting either swollen cristae (B4, C4, arrows), or even cristae reduced to a few vesicles (B1-2, C2). In a few mitochondria the cristae were even ultra-condensed to a dense core separated from the outer membrane by a vesicle (arrows, B3.1–2, C1). The abnormal mitochondria most often bounded the limits between the crystal-like organized (o) and disorganized (d) myofibrils. |
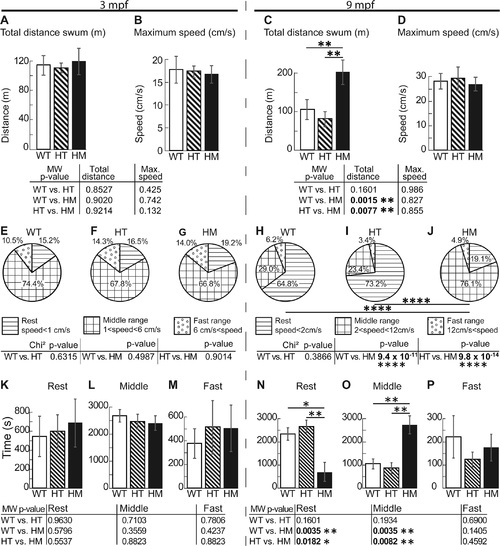
The 9 mpf col6a1ama605003 HM fish swam around twice the distance of WT and HT fish. We video-recorded free-swimming WT, HT and HM col6a1ama605003 fish at 3 mpf and 9 mpf for one hour in the horizontal plane, then we calculated by triangulation the total distance swum (A, C) and the maximum instantaneous speed (B, D). (A) At 3 mpf, there was no significant difference in the total distance swam between WT and HT, between WT and HM or between HT and HM. (C) At 9 mpf, there was a significant difference in the total swum distance between WT and HM (C, p-value 0.0015) and between HT and HM (C, p-value 0.0077), but not between WT and HT, indicating the late development of impairment in HM. There was no difference in the maximum speed between genotypes at the two ages studied (B, D). (E-J) We represented in pie-charts the speed activity profile (SAP) distributions in percentage of 3 classes and according to the fish bl. i.e. rest SAP (horizontal lines, speed slower than 1 cm/s for 3 mpf, E, and 2 cm/s for 9 mpf, H), middle range SAP (squares, speed comprise between 1 to 6 cm/s for 3 mpf, F and 2 to 12 cm/s for 9 mpf, I) and fast SAP (open dots, speed superior to 6 cm/s for 3 mpf, G and to 12 cm/s for 9 mpf, J). This representation allowed us to show that at 9 mpf, there is a highly significant difference between WT versus HM (H vs. J, p-value 9.421x10⁻¹¹) and between HT and HM (I vs. J, 9.83x10⁻¹⁴). We further analyzed in a pairwise manner the histograms of the time (s) fish swum in the 3 SAP classes (speed distribution) described above for 3 mpf (K, L and M for rest, middle and fast SAP respectively) and 9 mpf (N, O and P for rest, middle and fast SAP respectively). This analysis showed that there was no difference in SAP within any of the 3 mpf groups. But the analysis showed that 9 mpf HM swam significantly more time in middle range SAP at the expense of their resting time i.e. in the rest SAP the difference is significant between WT and HM (N, p-value 0.0035); between HT and HM (N, p-value 0.0182). In the middle range SAP, the difference was significant between WT and HM (O, p-value 0.0035) and between HT and HM (O, p-value 0.0082). For 3 mpf fish, n = 12, 16 and 11 for WT, HT and HM respectively; for 9 mpf fish, n = 15, 19 and 7 for WT, HT and HM respectively. For each histogram and pie-chart, we performed either a Mann-Whitney (MW) or Chi-square test respectively, with *, ** and **** indicating p-values of <0.05, 0.01 and 0.0001 respectively. PHENOTYPE:
|
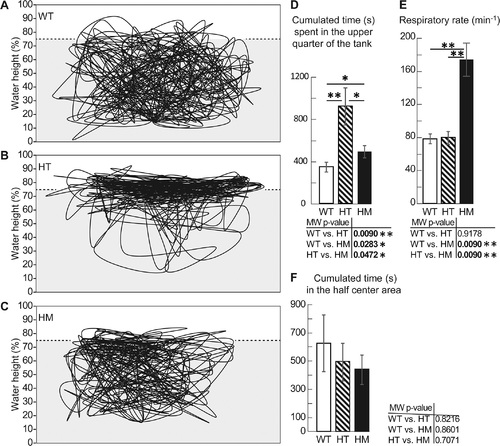
The 9 mpf col6a1ama605003 mutant fish presented a hypoxia behavior. We video-recorded for 30 min (25 frames/sec) and tracked the swimming trajectories in the vertical plane of WT, HT and HM col6a1ama605003 fish at 9 mpf in a tank. The position of the fish every 6 sec (1 frame every 150 frames) was plotted. A representative trajectory of each genotype is presented, WT (A), HT (B) and HM (C). From these videos (n = 5 of each genotype) the cumulated time fish swam in the upper quarter of the tank (D) was calculated and was significantly different between WT and HT (p-value 0.009), WT and HM (p-value 0.0283) and HT and HM (p-value 0.0472). HT and HM mutants spent visibly more time in the oxygen-richer part of the tank. The respiratory rate (oral/opercular movements, min-1) was determined for mutants and controls, n = 5 (E) and this rate was significantly different between WT and HM (p-value 0.009) and HT and HM (p-value 0.009). As a test for centrophobia, we measured the time fish spent in the centre of the tank in the horizontal plane. The centre corresponds to the half centre area of the tank. There was no difference of occupancy between the three genotypes. n = 15, 19 and 7 for WT, HT and HM respectively. For each histogram, a Mann-Whitney test was performed; *, ** indicate p-values of < 0.05 and < 0.01 respectively. PHENOTYPE:
|
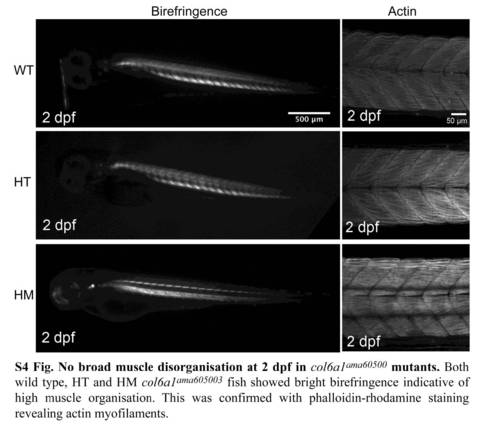
No broad muscle disorganisation at 2 dpf in col6a1ama60500 mutants. Both wild type, HT and HM col6a1ama605003 fish showed bright birefringence indicative of high muscle organisation. This was confirmed with phalloidin-rhodamine staining revealing actin myofilaments. |
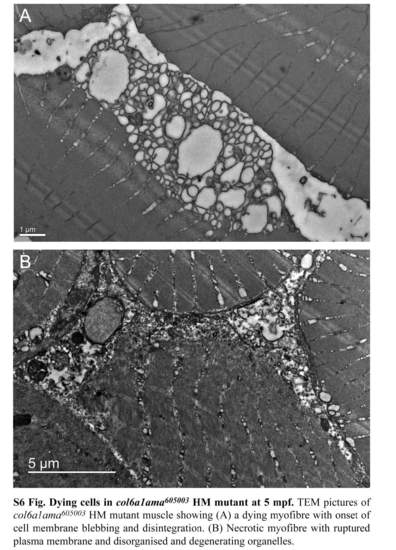
Dying cells in col6a1ama605003 HM mutant at 5 mpf. TEM pictures of col6a1ama605003 HM mutant muscle showing (A) a dying myofibre with onset of cell membrane blebbing and disintegration. (B) Necrotic myofibre with ruptured plasma membrane and disorganized and degenerating organelles. |