
- Title
-
Inactivation of ca10a and ca10b Genes Leads to Abnormal Embryonic Development and Alters Movement Pattern in Zebrafish
- Authors
- Aspatwar, A., Tolvanen, M.E., Ojanen, M.J., Barker, H.R., Saralahti, A.K., Bäuerlein, C.A., Ortutay, C., Pan, P., Kuuslahti, M., Parikka, M., Rämet, M., Parkkila, S.
- Source
- Full text @ PLoS One
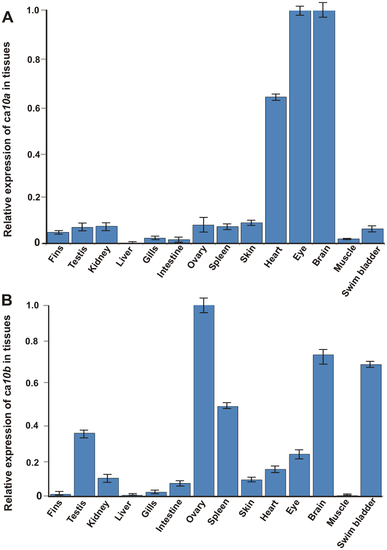
Expression levels of ca10a and ca10b genes in adult zebrafish tissues. A quantitative analysis of ca10a and ca10b genes was made for 14 adult zebrafish tissues using RT-qPCR. A, expression of ca10a in zebrafish tissues; B, expression of ca10b in zebrafish tissues. The values were normalized to the beta actin control according to the Pfaffl´s equation [34]. The expression of the ca10a gene in brain and ca10b in the ovary assigned a relative value of 1. |
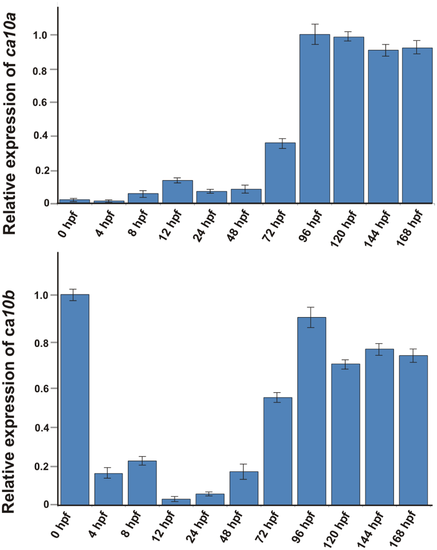
Expression analysis of ca10a and ca10b mRNAs during embryonic development. The expression levels of ca10a and ca10b were measured from the total mRNA isolated from the developing larvae of 0–168 hpf. A) Expression values of ca10a mRNA. B) Expression values of ca10b mRNA. The expression values were normalized to the beta actin control according to the equation of Pfaffl [34]. The expression of ca10a gene at 0 hpf and ca10b at 96 hpf assigned a relative value of 1. |

The ca10a and ca10b genes play an important role during embryonic development in zebrafish. Left panel: Developmental images of ca10a and ca10b morphant zebrafish injected with two different sets of antisense MOs (MO1 and MO2) over the period of 0 hpf to 5 dpf. A) The top row images show 0 hpf embryos and lateral views of 1–5 dpf uninjected zebrafish larvae with a normal development of organs,. B) ca10a morphant zebrafish injected with 200 µM translational blocking antisense morpholinos (MO1). C) Images of ca10b morphant zebrafish. D) and E) Images of ca10a and ca10b morphants. The images in first panel of D and E show the 1 dpf larvae with rhodamine fluorescence throughout the larvae (indicating successful MO injection) and second panel (D and E) shows the 5 dpf larvae with abnormal appearance. Right panel: Developmental images of ca10a and ca10b CRISPR mutated fish and gRNA controls. F) The top row images show 0 dpf embryos and lateral views of 1–5 dpf gRNA injected zebrafish larvae (control) with a normal development of organs. G) ca10a mutated zebrafish injected with gRNA and cas9 mRNA targeted to exon 3 (target site shown in Fig 7B). H) ca10b mutated zebrafish injected with gRNA and cas9 mRNA targeted to exon 1(target site shown in Fig 7C). |
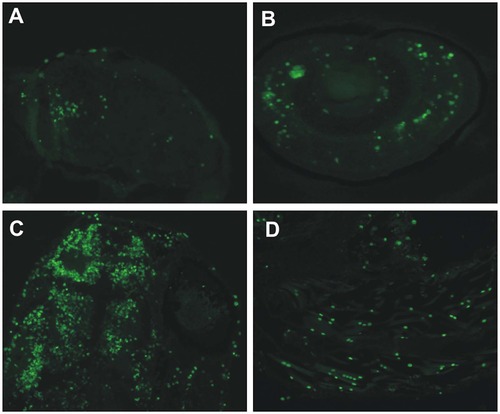
Knockdown of ca10a and ca10b genes leads to apoptosis in the morphant zebrafish. Results of the TUNEL assay detecting apoptotic cells in 5 dpf morphant embryos. A) head region of a ca10a morphant; B) eye region of a ca10a morphant; C) head region of a ca10b morphant; and D) tail regions of a ca10b morphant. (Original magnification 100X). PHENOTYPE:
|
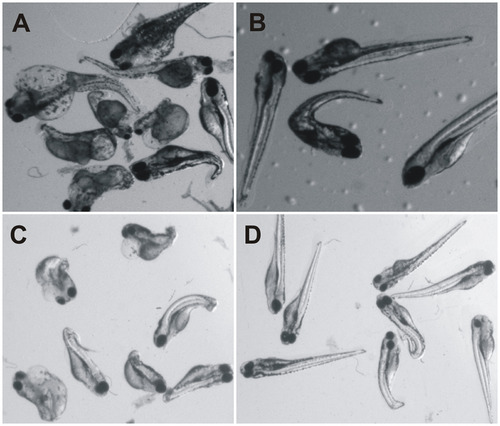
Partial rescue of ca10a and ca10b zebrafish morphants. A) The ca10a morphant (5dpf) embryos; B) The 5 dpf zebrafish ca10a morphant embryos rescued with injection of CA10 mRNA; C) The ca10b morphant (5dpf) embryos; D) Partially rescued 5dpf embryos with CA11 mRNA. |
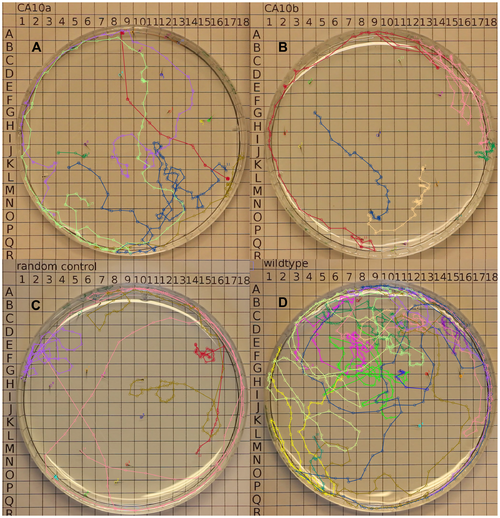
Displacement patterns of the morphant and control fish. Representative displacement trajectories of the movement pattern are shown for A) larvae injected with ca10a-MO2, B) larvae injected with ca10b-MO2 C) larvae injected with RC-MOs and, D) wildtype (uninjected) larvae. Groups of 13 to 22 fish were video recorded in 90mm petri dishes over a 2 minute time period. ImageJ and MtrackJ plugin were used to track the paths of all fish [39,40]. PHENOTYPE:
|
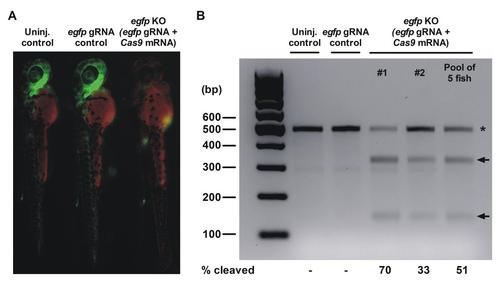
Silencing of egfp expression in tg(fli1a:egfp) zebrafish embryos using CRISPR/Cas9 mediated mutagenesis. A) Fluorescence microscopy was used to analyze the silencing of egfp in tg(fli1a:egfp) zebrafish embryos at 2 dpf. The un-injected control (left) and egfp gRNA injected control (middle) express egfp (green) in the vascular endothelium. The CRISPR-Cas9 mutated embryo (right) shows less fluorescence due to the disruption of the egfp gene. The red channel was used to detect auto-fluorescence. B) T7 endonuclease I (T7EI) assay was used to evaluate the egfp mutation efficiency in 2-day-old embryos. T7EI treated PCR products of un-injected and egfp gRNA injected control fish are shown in comparison to PCR products of two individual embryos and a pooled sample of 5 egfp silenced embryos. The full length wild type (WT) egfp product (470bp) is marked with an asterix. Arrows indicate the T7E1 cleaved PCR products in the egfp mutated embryos. |

ZFIN is incorporating published figure images and captions as part of an ongoing project. Figures from some publications have not yet been curated, or are not available for display because of copyright restrictions. PHENOTYPE:
|
|
ZFIN is incorporating published figure images and captions as part of an ongoing project. Figures from some publications have not yet been curated, or are not available for display because of copyright restrictions. PHENOTYPE:
|