
- Title
-
Control of tissue growth by Yap relies on cell density and F-actin in zebrafish fin regeneration
- Authors
- Mateus, R., Lourenço, R., Fang, Y., Brito, G., Farinho, A., Valério, F., Jacinto, A.
- Source
- Full text @ Development
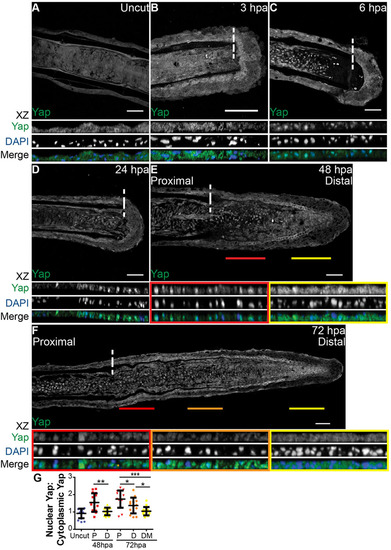
Yap is present and highly dynamic during fin regeneration. (A-F) Representative immunostaining with anti-Yap in caudal fin longitudinal sections at several regenerative stages. (A) Uncut control; (B) 3hpa; (C) 6hpa; (D) 24hpa; (E) 48hpa; (F) 72hpa. xz projections of mesenchymal regions highlight Yap intracellular localization. Distal (yellow) and proximal (red) lines at 48hpa (E), and distal-most (yellow), distal (orange) and proximal (red) lines at 72hpa (F), correspond to the mesenchymal areas in the medial blastema where xz projections were made (shown below). Dashed lines indicate amputation plane. n=10-15 sections; 5 fish/condition. Scale bars: 50µm. (G) Quantification of Yap intracellular localization by expressing a ratio between average intensities of nuclear Yap:cytoplasmic Yap of xz projections from blastemas at different time points. Higher ratios correspond to higher intensities of nuclear Yap. P corresponds to xz of proximal (red); D to distal (orange); DM to distal-most regions (yellow). *P<0.05, **P<0.01, ***P<0.001; two-tailed, non-parametric Mann–Whitney test. n=15 sections, 5 fish/condition. Mean±s.d. are shown. |
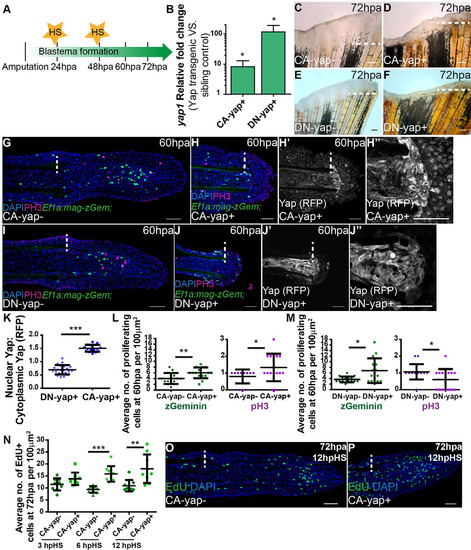
Yap influences proliferation in the blastema. (A) Experimental outline of heat-shock protocol used to access Yap functionality during regeneration. After amputations, fish were allowed to regenerate for 24h, the time at which the first heat-shock was performed. A second heat-shock at 48hpa was applied and phenotypes were assessed at 60hpa or 72hpa. The same protocol was applied to sibling controls. (B) qPCR determination of yap1 expression levels in blastemas of Yap transgenics versus respective siblings upon single heat-shock at 72hpa. RNA extraction was performed at 2hpHS. *P<0.01; two-tailed, non-parametric paired Wilcoxon test, logarithmic scale, base 10. (C-F) Representative brightfield images of Yap transgenics and siblings at 72hpa after the protocol shown in A was performed. (C) CA-yap control; (D) CA-yap positive; (E) DN-yap control; (F) DN-yap positive. n=5 fish/condition. Scale bars: 200µm. (G-J) Representative immunofluorescence with anti-pH3 in 60hpa longitudinal sections of double transgenics Ef1α:mag-zGeminin; CA-yap/DN-yap and siblings after the protocol shown in A was performed. (G) CA-yap control; (H) CA-yap positive; (I) DN-yap control; (J) DN-yap positive. (H′,H′′,J′,J′′) Corresponding transgenic CA-Yap and DN-Yap RFP expression. Siblings do not show RFP expression. Scale bars: 50µm. (K) Quantification of Yap-RFP intracellular localization in CA-yap and DN-yap transgenics by expressing a ratio between average intensities of nuclear Yap:cytoplasmic Yap of xz projections of respective mesenchymal cells. ***P<0.001; two-tailed, non-parametric Mann–Whitney test. n=16-23 sections, 3 fish/condition. (L,M) Quantification of average proliferation labeled with Geminin and pH3 occurring per 100µm2 in Ef1α:mag-zGeminin; CA-yap/DN-yap and siblings, at 60hpa. *P<0.05, **P<0.01; two-tailed, non-parametric Mann–Whitney test. n=15 sections, 3 fish/condition. (N) Quantification of average EdU-positive cells occurring per 100µm2 in CA-yap and siblings, at 72hpa in different times post heat-shock. **P<0.01, ***P<0.001; two-tailed, non-parametric Mann–Whitney test. n=9 sections, 3 fish/condition. (O,P) Representative immunofluorescence with EdU in 72hpa longitudinal sections of CA-yap and siblings after 12hpHS. (O) CA-yap control; (P) CA-yap positive. Scale bars: 50µm. Dashed lines indicate amputation plane. Mean±s.d. are shown. |
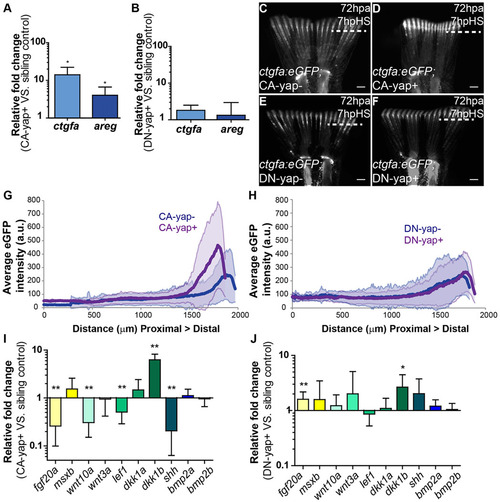
Transcriptional gene regulation induced by Yap. (A,B) qPCR determination of ctgfa and areg expression levels (relative to sibling controls) in blastemas of CA-yap positive (A) and DN-yap positive (B) transgenics upon single heat-shock at 72hpa. *P<0.01; two-tailed, non-parametric paired Wilcoxon test, logarithmic scale, base 10. (C-F) Representative ctgfa expression in double transgenics ctgfa:eGFP; CA-yap/DN-yap and siblings upon heat-shock at 72hpa, at 7hpHS. (C) CA-yap control; (D) CA-yap positive; (E) DN-yap control; (F) DN-yap positive. n=5 fish/condition. Scale bars: 500µm. Dashed lines indicate amputation plane. (G,H) Quantification of average eGFP intensity (in arbitrary units, a.u.) of individual rays including blastemas along the PD axis of double transgenics ctgfa:eGFP; CA-yap/DN-yap and siblings. (G) CA-yap positive and siblings; (H) DN-yap+ and siblings. n=80-90 rays, 5 fish/condition; shadows indicate the s.e.m. for each curve. (I,J) qPCR determination of fgf20a, msxb, wnt10a, wnt3a, lef1, dkk1a, dkk1b, shh, bmp2a and bmp2b expression levels (relative to sibling controls) in CA-yap positive (I) and DN-yap positive (J) transgenics upon single heat-shock at 72hpa. *P<0.05, **P<0.01; two-tailed, non-parametric paired Wilcoxon test, logarithmic scale, base 10. All RNA extractions were performed at 2hpHS. Mean±s.d. are shown. |

Mesenchymal cell density and morphology are altered according to the regenerative stage. (A-C) Quantification of average DAPI intensity (in arbitrary units, a.u.) in mesenchymal cells along the PD axis of blastemas at 24hpa (A), 48hpa (B) and 72hpa (C). n=7 sections, 3 fish/condition. (D-F) Representative DAPI-stained longitudinal sections of blastemas at 24hpa (D), 48hpa (E) and 72hpa (F). (G-I) Quantification of average space (a.u.) between mesenchymal cells along the PD axis at 24hpa (G), 48hpa (H) and 72hpa (I). n=9 sections; 3 fish/condition. (J-L) Representative anti-GFP-stained longitudinal sections of ctgfa:eGFP transgenics at 24hpa (J), 48hpa (K) and 72hpa (L). (M) Quantification of average cell aspect ratio of mesenchymal cells at 24, 48 and 72hpa, in which y is the minor axis of the cell and x the major cell axis. A perfect circular shape corresponds to a ratio between y and x of 1. P corresponds to proximal; D to distal regions. ***P<0.0001; two-tailed, non-parametric Mann–Whitney test. n=45 cells/condition; 5 cells randomly selected/image; 9 sections; 3 fish/condition. (N-R) High magnification images of the boxed areas in J-L highlight cell morphology of blastema cells at 24hpa (N); 48hpa proximally (O) and distally (P); and 72hpa proximally (Q) and distally (R). Dashed lines indicate amputation plane. Scale bars: 50µm. Medial blastema areas were considered for all measurements: shadows indicate the s.e.m. for each curve. |
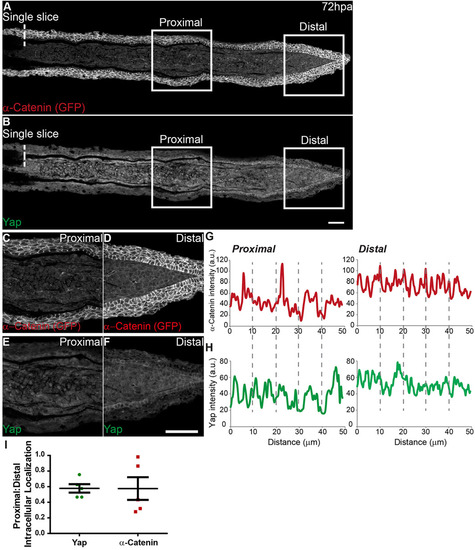
α-Catenin accumulates in distal blastema regions where Yap is mainly cytoplasmic. (A-F) Representative immunofluorescence with anti-Yap and anti-GFP antibodies in 72hpa longitudinal sections of α-Catenin transgenics. Owing to stronger expression intensity, transgenics were used instead of the α-Catenin antibody. (A) α-Catenin; (B) corresponding Yap expression. (C-F) High magnification images of the boxed areas in A,B showing α-Catenin (C, proximal; D, distal) and Yap (E, proximal; F, distal) expression. (G,H) Corresponding proximal and distal intensity profiles (in arbitrary units, a.u.) of the medial mesenchymal cells shown in C-F showing average intensity of α-Catenin (G) and Yap (H). (I) Quantification of changes in intracellular localization of Yap and α-Catenin across the PD axis by expressing a ratio between average intensities of proximal:distal Yap or α-Catenin of xz projections of respective mesenchymal cells. Mean±s.d. are shown. Dashed lines indicate amputation plane. n=5 sections, 3 fish. Scale bars: 50µm. |
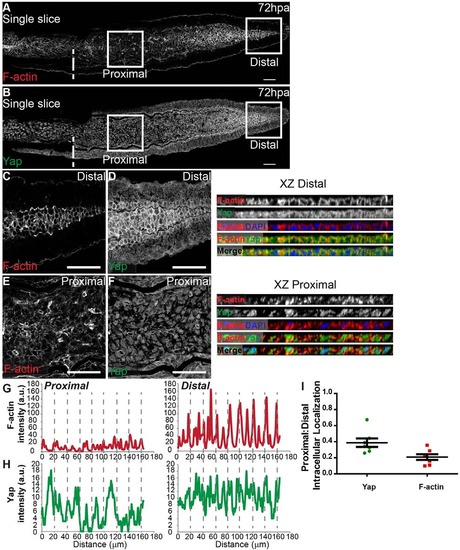
Differential PD expression of F-actin associates with Yap intracellular location. (A-F) Representative immunofluorescence with anti-Yap antibody and phalloidin (F-actin) in 72hpa longitudinal sections. (A) F-actin; (B) corresponding Yap expression. (C-F) High magnification images of the boxed areas in A,B showing F-actin (C,E) and Yap (D,F) localization in proximal (E,F) and distal (C,D) regions. Single color and merged xz projections of distal (C,D) and proximal (E,F) blastemas highlight intracellular localization. (G,H) Corresponding proximal and distal intensity profiles (in arbitrary units, a.u.) of xz projections represented showing average intensity of F-actin (G) and Yap (H). (I) Quantification changes in intracellular localization of Yap and F-actin across the PD axis by expressing a ratio between average intensities of proximal:distal Yap or F-actin of xz projections of respective mesenchymal cells. Mean±s.d. are shown. Dashed lines indicate amputation plane. n=7 sections, 5 fish. Scale bars: 50µm. |
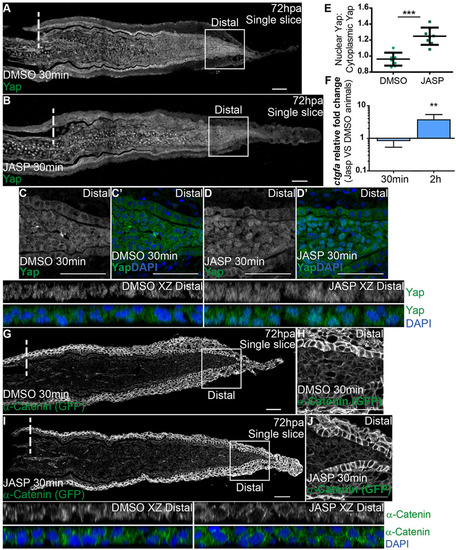
F-actin controls Yap intracellular dynamics. (A-D′) Representative immunofluorescence with anti-Yap antibody in 72hpa longitudinal sections of α-Catenin transgenics injected with jasplakinolide (JASP; B) and DMSO controls (A). (C-D′) High magnification images of the boxed areas in A,B showing Yap and DAPI in DMSO (C,C′) and JASP (D,D′) conditions. Corresponding xz projections of the distal blastemas shown in C,D highlight intracellular localization (DMSO XZ Distal, JASP XZ Distal). (E) Quantification of Yap intracellular localization by expressing a ratio between average intensities of nuclear Yap:cytoplasmic Yap of xz projections from distal blastemas in DMSO or JASP conditions, at 30min post injection. Higher ratios correspond to higher intensities of nuclear Yap. ***P<0.001, two-tailed, non-parametric Mann–Whitney test. n=8 sections, 4 fish/condition. (F) qPCR determination of ctgfa levels in JASP versus DMSO animals, at 30min and 2h post injection, time points when RNA was extracted from blastemas. **P<0.01; two-tailed, non-parametric paired Wilcoxon test, logarithmic scale, base 10. (G-J) α-Catenin (anti-GFP) expression in animals injected with DMSO (G,H) or JASP (I,J). (H,J) High magnification images of the boxed areas in G,I showing α-Catenin in distal blastemas of animals injected with DMSO (H) or JASP (J). Corresponding xz projections of the distal blastemas shown in H,J highlight intracellular localization of α-Catenin and DAPI. Intraperitoneal injections were performed in 72hpa animals, 30min pre-fixation of blastemas. n=12 sections, 4 fish/condition. Mean±s.d. are shown. Dashed lines indicate amputation plane. Scale bars: 50µm. |

Hippo pathway components are present during zebrafish caudal fin regeneration. Related to Fig 1. A Representative in situ hybridizations for nf2b, stk3 (mst2), sav1, yap1 and frmd6 (expanded) at 24 hpa, 48hpa, 72 hpa, 96 hpa, 120 hpa and uncut fins. n=3 fins per condition. Scale bars correspond to 100µm. B qPCR determination of yap1, wwtr1 (taz), lats2, stk3 (mst2), tead1a and tead4 relative expression levels during several regenerative stages (24 hpa, 30 hpa, 48 hpa, 72 hpa and 120 hpa) versus uncut controls. Logarithmic scale, base 10. C-E Representative immunofluorescence images against phosphorylated Mst 1/2 (C), phosphorylated Lats 1/2 (D) and total NF2 (E) in 72 hpa blastemas. F-G Quantification of average phospho-Mst 1/2 (F) and phospho-Lats 1/2 (G) intensity (in arbitrary units, a.u.) in mesenchymal cells along the PD axis (µm) of blastemas at 72 hpa. n=5 sections, 3 fish per condition. Shadows indicate the standard deviation of the mean for each curve. For all measurements, areas from the medial blastema were considered. Dashed lines indicate amputation plane. Scale bars correspond to 50µm. |
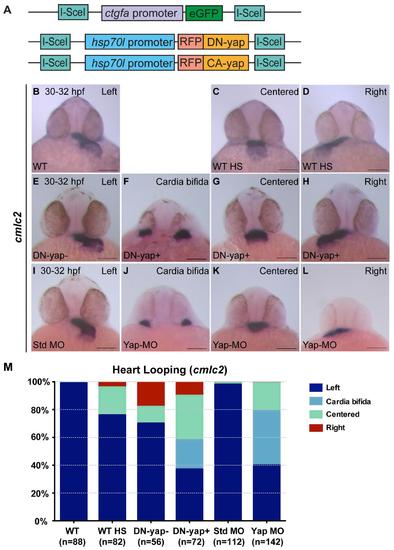
DN-Yap transgenic line regulates cardiac precursor cell migration. Related to Fig 2. A Schematics of the constructs of the transgenics used in this study. Note that CA-yap transgenics have mutated the five yap1 consensus motifs HxRxxS recognized by Lats 1/2, having the Serines substituted by Alanines, not allowing Yap to be inactivated through phosphorylation (Zhao et al., 2007). In DN-yap transgenics, a truncated form of CA-yap was used, in which the transcriptional activation domain was removed, but its Tead binding domain was left intact, allowing Yap to bind to its DNA partner but not activate its targets (Zhao et al., 2007). B-M Zebrafish embryos with 30-32 hpf examined for cardiac jogging by in situ hybridization for cmlc2. B-D WT embryos with normal left-sided heart jogging (99%) (B) and few centered hearts (1%) (not shown). WT embryos given a heat-shock (hs) at 16 cells stage develop centered (20%) (C) and right-sided hearts (4%) (D), consequence of the hs itself. E-H A hs was given to DN-yap siblings (DN-yap-) at 16 cells stage, with the majority of embryos developing left-sided hearts (70%) (E), centered (12%) and right-sided (18%) hearts, the latter being a consequence of the hs itself (not shown). DN-yap positive (DN-yap+) transgenic embryos were activated at 16 cells stage with a hs and develop cardia bífida (21%) (F), a characteristic phenotype of loss of Yap (Fukui et al., 2014; Miesfeld and Link, 2014). They also develop centered (32%) (G), right (10%) (H) and left-sided hearts (37%) (not shown). I-L Standard-MO (6 ng) WT injected embryos develop mainly left-sided hearts (98%) (I), with few developing centered (1%) and right-sided (1%) hearts (not shown). Yap-MO (6 ng) WT injected embryos develop cardia bífida (39%) as previously shown (J) (Fukui et al., 2014; Miesfeld and Link, 2014). They also develop centered (20%) (K), right (1%) (L) and left-sided hearts (40%) (not shown). M Percentage of embryos with different phenotypes for heart jogging. Total number of embryos is shown in the bottom of each column. All scale bars are 100µm. |
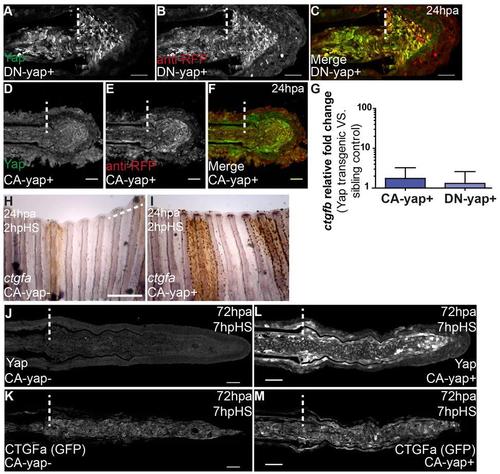
ctgfa is conserved as a direct transcriptional target of Yap in zebrafish. Related to Figs 2 and 3. A-F Representative immunostainings with anti-Yap and anti-RFP in 24 hpa longitudinal sections of CA-yap and DN-Yap positive transgenics, upon heat-shock. A-C DNYap+; D-F CA-Yap+. Note that for further experiments anti-Yap was used instead of anti-RFP due to clearer intracellular labeling. G qPCR determination of ctgfb relative expression levels in CA-yap and DN-yap positive transgenics versus respective sibling controls, upon single heatshock at 72 hpa. Logarithmic scale, base 10. H-I Representative in situ hybridization for ctgfa in 24 hpa fins of CA-yap sibling control (H) and CA-yap+ fish (I). Fins were collected at 2 hpHS. n=3 fins per condition. Scale bars correspond to 500µm. J-M Representative immunostainings with anti-Yap and anti-GFP in 72 hpa longitudinal sections of ctgfa:eGFP; CA-yap double transgenics, fins were fixed at 7 hpHS. J,K CA-yap sibling control; L,M CAyap+. Note that due to high Yap levels in L, normal settings in acquisition of images in J, L had to be decreased to avoid image saturation. n=9 sections, 3 fish per condition. Scale bars correspond to 50µm. Dashed lines indicate amputation plane. |

Cell death occurs after the proliferative boost in CA-Yap transgenics but not in DN-Yap transgenics. A-D Representative immunofluorescence with EdU in 72 hpa longitudinal sections of CA-yap sibling controls (A) and CA-yap positive fish (B) at 3 hours post single heat-shock (hpHS); CA-yap sibling controls (C) and CA-yap positive fish (D) at 6 hpHS. Representative immunofluorescence with Tunel in 90 and 108 hpa longitudinal sections of CA-yap sibling controls (E,G), CA-yap positive (F,H), DN-yap sibling controls (I,K) and DN-yap positive transgenics (J,L). Scale bars correspond to 50µm. M-N Quantification of average Tunel positive cells occurring per 100µm2 in DN-yap and siblings (M) and CA-yap and siblings (N), at different times post amputation, after a single heat-shock at 72 hpa. *P value<0.05, two tailed, non-parametric Mann-Whitney test. n=9 sections, 3 fish per condition. Dashed lines indicate amputation plane. |

Yap is not activated in a homeostatic context. A-B, E-F Representative brightfield images of uninjured CA-yap/DN-yap transgenics upon heat-shock in 2 consecutive days, phenotypes were accessed the next day. A CA-yap control; (B) CA-yap+; (E) DN-yap control; F DN-yap+. C-D, G-H, I-J Representative ctgfa expression in double transgenics ctgfa:eGFP; CA-yap/DN-yap and siblings upon heat-shock in uncut or 72 hpa half amputated fin animals, at 7 hpHS. C CA-yap control; (D) CA-yap+; (G) DN-yap control; (H) DN-yap+; (I) CA-yap control; (J) CA-yap+. n=5 fish/ condition. K-N Representative in situ hybridizations for yap1 in 72 hpa half amputated fins of CA-yap control (K), CA-yap+ (L), DN-yap control (M), DN-yap+ (N). Corresponding zooms of uncut half (K′-N′), 72 hpa regenerate half (K′′-N′′) of in situs shown in K-N, highlighting yap1 differences in CA-yap/DN-yap transgenics versus siblings. Fins were collected at 2 hpHS. n=3 fins/condition. Scale bars=500µm. Dashed lines indicate amputation plane. |

Novel adhesion and cytoskeleton proteins expressed in the regenerating blastema. Related to Fig 4. Representative immunostainings of positive hits found in the adhesion and cytoskeleton related screen performed in formed blastemas (48 and 72 hpa longitudinal sections). n=3 sections per condition. Dashed lines indicate amputation plane. Scale bars correspond to 50µm. |
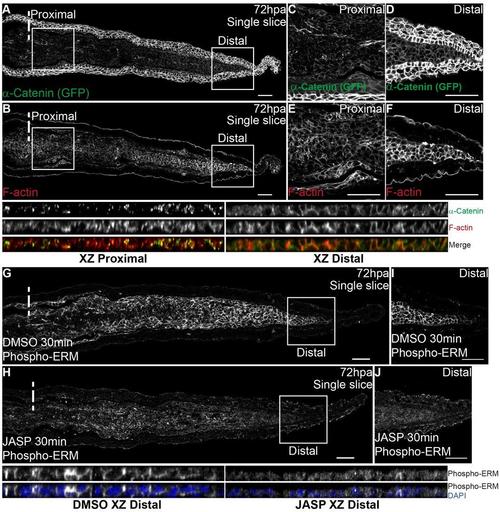
α-Catenin and F-actin partially co-localize in the regenerating blastema. Related to Fig 6. A,B Representative immunofluorescence with anti-GFP and phalloidin (F-actin) in 72 hpa longitudinal sections of α-Catenin transgenics. A Representative single frame of α-Catenin; (B) Corresponding single frame of F-actin. C-F Corresponding zoomed areas represented by squares in A-B. Proximal (C) and distal (D) zoomed images from A showing the differential α- Catenin expression along the PD axis. Corresponding proximal (E) and distal (F) zoomed images from B showing the differential F-actin expression along the PD axis. Single color and merged XZ projections of proximal blastema images C,E and distal blastema images D,F are shown below the corresponding panel to highlight intracellular localization. n=9 sections, 3 fish. G-H Representative immunofluorescence with anti-Phospho-ERM (representing F-actin) in 72 hpa longitudinal sections of animals injected with Jasplakinolide (JASP) and respective DMSO controls. Phospho-ERM expression in DMSO (G) and JASP (H) animals. I-J Zoomed areas represented by squares in G-H, showing Phospho-ERM expression in the distal blastema of DMSO (I) and JASP (J) animals. Corresponding XZ projections of distal blastema images I-J are shown to highlight intracellular localization in both situations; single color images showing Phospho-ERM expression and merged with DAPI. Intraperitoneal injections were performed in 72 hpa animals, 30 minutes pre-fixation of the caudal fins. n=8 sections, 4 fish per condition. Dashed lines indicate amputation plane. Scale bars correspond to 50µm. |