
- Title
-
Remodeling of Mitochondrial Flashes in Muscular Development and Dystrophy in Zebrafish
- Authors
- Zhang, M., Sun, T., Jian, C., Lei, L., Han, P., Lv, Q., Yang, R., Zhou, X., Xu, J., Hu, Y., Men, Y., Huang, Y., Zhang, C., Zhu, X., Wang, X., Cheng, H., Xiong, J.W.
- Source
- Full text @ PLoS One
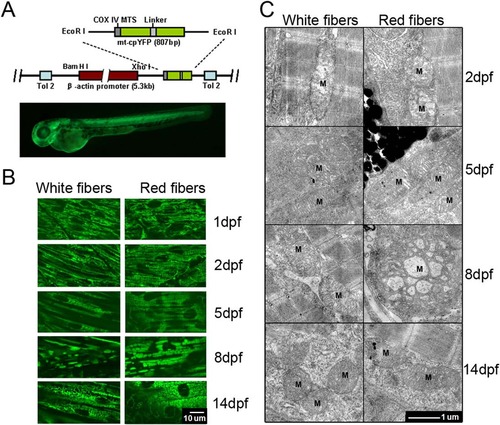
Mitochondrial morphogenesis in developing zebrafish skeletal muscles. (A) Top: A schematic map of Tg(β-actin:mt-cpYFP) reporter construct, in which mt-cpYFP was driven by the chicken β-actin promoter. The N-terminus of cpYFP was tagged with the COX IV mitochondrial localization signal (COX IV MTS). The transgene was flanked with Tol2 elements (Tol2) to facilitate transgenesis in zebrafish. Bottom: ubiquitous expression of mt-cpYFP in a Tg(β-actin:mt-cpYFP) transgenic embryo at 2 dpf. (B) Confocal images of mitochondria in white (left panels) and red (right panels) skeletal muscles of Tg(β-actin:mt-cpYFP) embryos from 1 to 14 dpf. Note the fibrillar mitochondria at 1 and 2 dpf, while the rod-like mitochondria at 5, 8 and 14 dpf in white skeletal muscles, whereas large brick-like at 8 dpf and smaller bead-like mitochondria at 5 and 14 dpf in red skeletal muscles. Scale bar, 10 µm. (C) Transmission electron microscopic images of mitochondria (M) in white (left panels) and red (right panels) skeletal muscle cells of Tg(β-actin:mt-cpYFP) transgenic embryos from 2 to 14 dpf. Red skeletal muscle cells were identified along with melanocytes. Note fewer immature cristae in mitochondria at 2 dpf but well-developed cristae in mitochondria at 5, 8 and 14 dpf in both red and white muscle fibers. Mitochondria were particularly enlarged in red muscle cells at 8 dpf. Scale bar, 1 µm. EXPRESSION / LABELING:
Construct:
Tg(Gga.Actb:MITO-cpYFP)
|
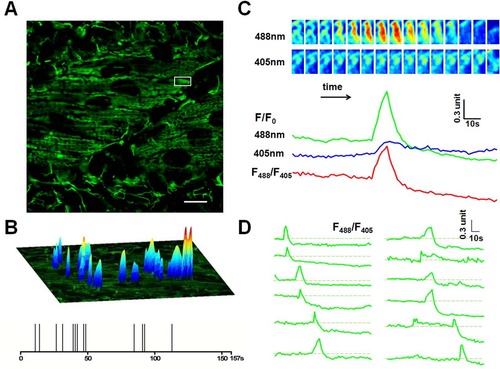
Mitoflash activities in red skeletal muscles of 2 dpf zebrafish embryos. (A). Time-lapse recording of mitoflashes in red skeletal muscles of a mt-cpYFP transgenic embryo. Scale bar, 10 µm. See S1 Movie. (B) Amplitudes, spatial and temporal distribution of the mitoflash signals occurring during a 157-s recording period. The spikes in the temporal diary in the lower panel just reflect the temporal distribution of the mitoflashes, so they are of the same height. The upper surface plots overlaying the mitochondria image mainly indicate the spatial location, intensity and spatial morphology of mitoflashes. Their height is defined according to respective mitoflash peak amplitude ΔF/F0, instead of the background intensity. (C) Time course of a representative mitoflash from the boxed region in panel A. Upper panel: time sequence of the mitoflash seen alternatively at 488 nm and 405 nm excitation. Lower panel: line plots of normalized cpYFP signals (F/F0) under 488 nm and 405 nm excitation and their ratio (F488/F405), the latter removes motion artifacts associated with mitochondrial swelling. (D) Diverse morphology of mitoflashes of the same skeletal muscle. The traces were arranged by the start points of the major mitoflash event seen in a single trace. Photobleaching (~10%) was corrected based on global intensity decay and the dashed lines mark the basal level. Traces of the last 31 s are not shown due to motion artifacts caused by muscle twitch (see S1 Movie). EXPRESSION / LABELING:
|
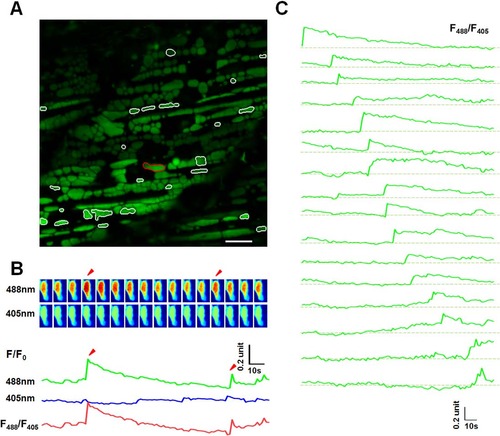
Mitoflash activities in red skeletal muscles of 8 dpf zebrafish embryos. (A) The same as in Fig 2A, except that the data were from a red skeletal muscle at 8 dpf. White contours mark mitochondria undergoing mitoflashes. Scale bar, 10 µm. See also S2 Movie. (B) A representative mitoflash (marked in panel A with red-color coded contour). The same as in in Fig 2B. Arrow heads mark two consecutive mitoflashes in the same mitochondria. Upper panel: time sequence of the mitoflash seen alternatively at 488 nm and 405 nm excitation and their ratio (F488/F405). Note that the ratiometric line plot, F488/F405, largely eliminated motion artifacts. (C) A family of traces showing diversified time courses of mitoflashes from red skeletal muscle at this developmental stage. The traces were arranged by the start points of mitoflash events. Photobleaching (~10%) was corrected based on global intensity decay and the dashed lines mark the basal level. Note the distinct developmental differences compared to mitoflashes in Fig 2D. EXPRESSION / LABELING:
|
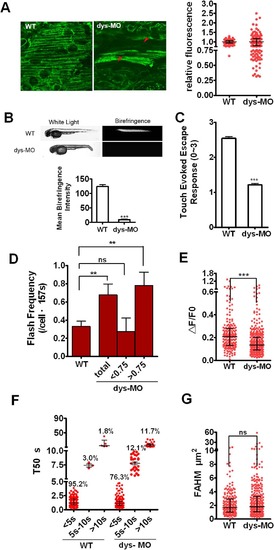
Mitoflashes are switched to lower ΔF/F0 amplitude and R-type mitoflashes in dystrophin morphants. (A) Live images of mitoflashes in mitochondria of a wild-type mt-cpYFP transgenic embryo and dys-MO morphant (left) and the relative fluorescence between them (right). Note the heterogeneity of cpYFP signals in red muscle cells in dystrophin morphants, giving rise to a highly scattered cellular cpYFP intensity distribution (A, arrowheads). About half of the cells in morphants showed relative fluorescent <0.75 to the average. (B) Upper: Birefringence was determined in embryos of wild type (WT) and dystrophin morphant (dys-MO). Corresponding bright-field images were shown in the left panels. Note the diminished birefringence in a dys-MO morphant. Lower: statistic of the mean birefringence intensity between the two groups. (C) Touch-evoked escape response was determined in 56 hpf embryos. Note reduced motor function of dys-MO morphants. (D-G) Mitoflash frequency, ΔF/F0, T50 and FAHM of red skeletal muscle cells were measured in a wild-type transgenic embryo (WT) and dys-MO morphant (dys-MO). When dys-MO cells were divided into 2 subsets of relative fluorescence, the cells with relative fluorescence >0.75 showed higher frequency that led to overall higher mitoflash frequency in dys-MO morphants than WT. Note ΔF/F0 amplitude decreased while FAHM had no changes, but T50 (>10s) increased due to longer T50 for S-type mitoflashes and the emergence of transitory and R-type mitoflashes in dystrophin morphants. For mitoflash analysis of WT embryos and dys-MO morphants at 2 dpf, we examined 8 and 11 individual embryos, as well as generated 43 and 57 frames for red muscle fibers, respectively. Data were reported as median with interquartile range at 1/4, 1/2 and 3/4 of the data, respectively (Fig 5A, E-G) and mean ± SEM (for Fig 5B-D). Unpaired t test with Welch’s correction (Fig 5A-D) and Mann-Whitney test (Fig 5E and G) was applied to determine statistical significance of the differences. **: p <0.01 versus wild-type group, ***: p <0.0001 versus wild-type group. |
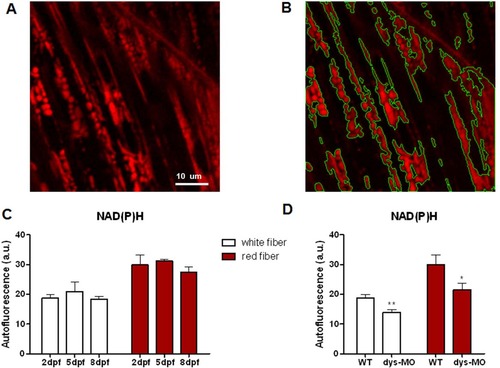
NAD(P)H signal is relatively stable during normal development but reduced in dystrophin morphants. (A) NAD(P)H signal of white skeletal muscle cells of zebrafish embryo at 5dpf. Scale bar,10µm. (B) Intensity-based segmentation of mitochondria. NAD(P)H signal was defined as mean intensity of mitochondrial regions. (C) NAD(P)H autofluorescence in the mitochondria of red (right) and white (left) skeletal muscle cells of wild-type embryos at 2, 5 and 8 dpf. No significant change of NAD(P)H was observed during development in either red or white fibers. N = 5–13 animals per group. (D) NAD(P)H signal was significantly decreased in both red and white fibers of dys-MO morphants (dys-MO) compared with wild-type (WT) controls. Data are expressed as the mean±SEM. *: p<0.05; **: p<0.01 versus wild-type group. PHENOTYPE:
|
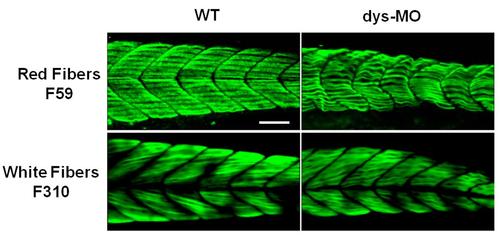
Immunostaining distinguished the red and white fibers of skeletal muscles. Red fibers were labeled by F59 antibody for slow myosin (n=20) and white fibers were labeled by F310 antibody for fast myosin (n=18). Distinctive mitochondrial morphologies were found in these fiber types at 2 dpf as shown in Figure B and S1 Movie. Note abnormalities of these fibers in dys-MO-injected morphants. Scale bar, 50 µm. |
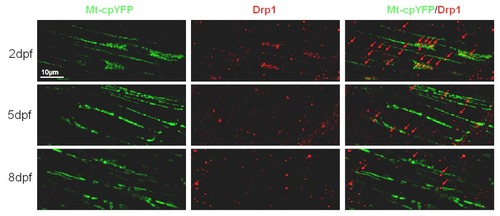
Drp1 were decreasing during zebrafish skeletal muscle development. Note that Drp1 was recruited overlapped with or between Tg(β-actin:mt-cpYFP)-positive mitochondria, decreasing from 2-dpf (n=18), 5-dpf (n=15) to 8-dpf embryos (n=14). Due to severe cpYFP signal loss after fixation, we only investigated mt-cpYFP signals in white fibers. |
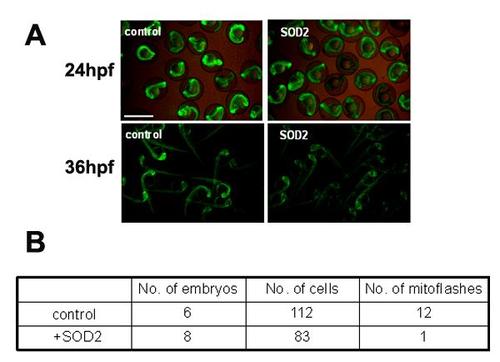
Basal cpYFP signal was decreased in zebrafish embryos overexpressing sod2. Injection of sod2 mRNA decreased the cpYFP fluorescent level at 24 hpf and 36 hpf (Figure A), and suppressed mitoflash activity in red fibers of embryos at 2 dpf (Figure B). Tg(β-actin:mt-cpYFP) transgenic embryos were injected with sod2 mRNA and were then used for measuring mitoflashes in vivo. The red and white fibers of the trunk skeletal muscles were recorded for mitoflashes, and imaged using a 40X, 1.3NA H2O immersion objective at a sampling rate of 1.57 s/frame on Zeiss 710 confocal microscope. Time-lapse images of 100 frames were acquired continuously each time. Scale bar, 10 µm. |
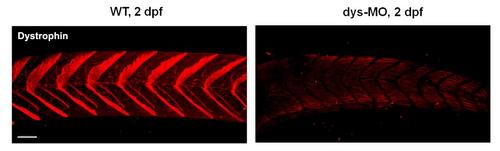
Dystrophin was efficiently reduced by dys-MO. Dystrophin was expressed in V-shape in the neuromuscular junction in wild-type (WT) controls (n=32) but not in dys-MO injected embryos (n=46) at 2 dpf. This result is consistent with the previous report by Bassett et al. (2003). Scale bar, 50 µm. |