
- Title
-
Mutation of kri1l causes definitive hematopoiesis failure via PERK-dependent excessive autophagy induction
- Authors
- Jia, X.E., Ma, K., Xu, T., Gao, L., Wu, S., Fu, C., Zhang, W., Wang, Z., Liu, K., Dong, M., Jing, C., Ren, C., Dong, Z., Chen, Y., Jin, Y., Huang, Q., Chang, X., Deng, M., Li, L., Luo, L., Zhu, J., Dang, Y., Chang, H.C., Zon, L.I., Zhou, Y., Chen, S., Pan, W.
- Source
- Full text @ Cell Res.
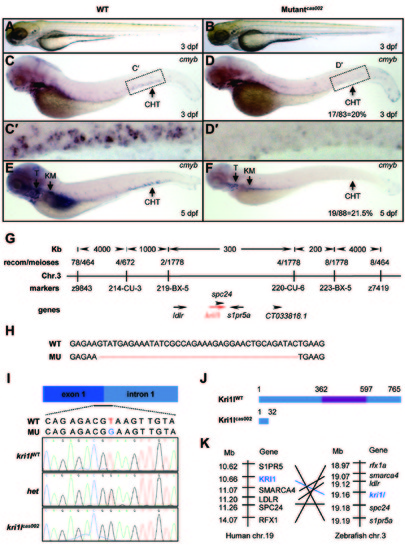
Hematopoietic defects and positional cloning of cas002 mutant. (A-B) Light microscope images of zebrafish wild-type (WT) and cas002 embryos at 3 dpf. (C-F) WISH analysis of cmyb expression in WT and cas002 embryos at indicated development stages. Black arrows indicate thymus, kidney marrow and CHT. (C′-D′) enlarged CHT regions in C and D. (G) Genetic mapping of the cas002 region on chromosome 3. Bulk segregation analysis locates cas002 mutation to Chr. 3. Fine mapping using SSLPs narrows down to a region between markers 219-BX-5 and 220-CU-6, containing kri1l and four other genes as indicated. (H) The sequencing results of kri1l cDNA from mutant embryos show a 38 bp deletion (MU) compared with kri1l cDNA from WT embryos. (I, J) The sequencing result of kri1l genomic DNA shows a T-G transversion at the kri1l exon 1-intron 1 consensus splicing donor site (I), which causes a frame shift (H) and a premature stop codon leading to the production of a truncated Kri1l protein (J). (K) Synteny between zebrafish kri1l I and human KRI1 loci. (Left) Six genes, including KRI1, are located within a genomic region on human chromosome 19. (Right) Six zebrafish homologs are listed according to their map positions on chromosome 3 (Ensembl website). CHT, caudal hematopoietic tissue; KM, kidney marrow; Mb, mega base; T, thymus; het, heterozygote. EXPRESSION / LABELING:
PHENOTYPE:
|
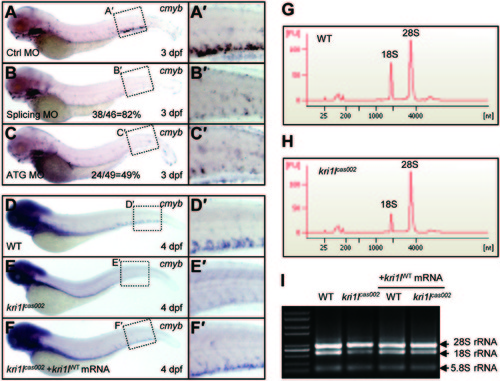
Mutation in kri1l gene is responsible for cas002 phenotypes. (A-C) Morpholino knockdown of kri1l phenocopies cas002 mutant. kri1l ATG MO and splicing MO were injected into wild-type embryos at one-cell stage. At 3 dpf, the injected embryos were fixed and analyzed for cmyb expression by WISH. The percentage of morphants with the reduced cmyb expression phenotype is listed at the bottom of B and C. (D-F) Transient expression of wild-type kri1l mRNA rescues cas002 mutant. cas002 mutant embryos at one-cell stage were injected with synthesized wild type kri1l mRNA. The injected embryos were fixed for analysis of cmyb gene expression using WISH at 4 dpf. After WISH and photographing, all embryos were genotyped by sequencing of genomic DNA; the percentage of the rescue was then evaluated. The percentage of fully rescued mutant embryos is about 54% (50/92), while the rest are partially rescued. (A2-F2) Details of cmyb expression in CHT regions in A-F. (G-H) E-Bioanalyser analysis of total RNA isolated from WT and kri1lcas002 embryo pools (each pool of 12 embryos) at 3 dpf. A significant reduction in the 18S peak but unchanged 28S peak in kri1lcas002 results in an elevated 28S/18S rRNA ratio. (I) The 18S rRNA reduction can be restored in mutant embryos by injection of kri1lWT mRNA. EXPRESSION / LABELING:
|
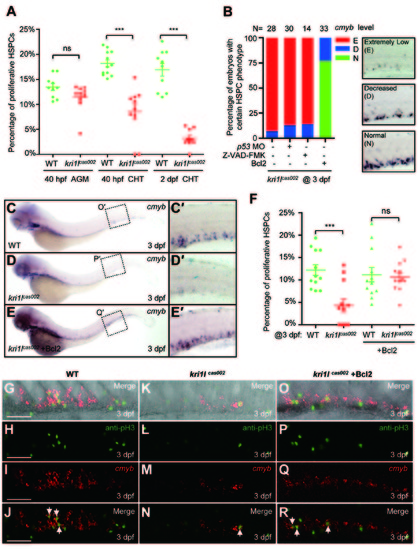
Transient expression of Bcl2 rescues the defective hematopoiesis in kri1lcas002 mutant embryos. (A) Statistic analysis of the proportion of proliferative HSPCs (cmyb and PH3 double positive) in total HSPCs in kri1lcas002 mutant embryos and wild-type siblings during hematopoietic development (40 hpf-2 dpf). N e 10 for each group. 40 hpf AGM, p = 0.0873; 40 hpf CHT, p < 0.0001; 2 dpf CHT, p<0.0001. Error bars represent SEM. **P ≤ 0.01; ***P ≤ 0.001 (Student′s t-test). (B) Proportion of kri1lcas002 mutant embryos with classified hematopoiesis phenotype (indicated by cmyb staining) with or without microinjection of p53 MO, treatment with caspase inhibitor (Z-VAD-FMK) or Bcl2 expression, respectively. (C-E) The CHT hematopoiesis is recovered by Bcl2 overexpression in kri1lcas002 mutant embryos. Embryos from two heterozygous parents were injected with bcl2 mRNA at one-cell stage and harvested for WISH analysis. After WISH and photographing, all embryos were genotyped by genomic DNA sequencing; percentage of rescue was then calculated. 26 out of 33 mutant embryos injected at one-cell stage with bcl2 mRNA are fully rescued, while the rest of embryos are partially rescued. (C′-E′) The enlarged CHT regions. (F) Percentage of the proliferative HSPCs in the CHT of kri1lcas002 mutant embryos and wild-type siblings with or without Bcl2 overexpression at 3 dpf. N = 12 for each group. Without Bcl2 overexpression, p < 0.0001; With Bcl2 overexpression, p = 0.3136. Error bars represent SEM. **P ≤ 0.01; ***P ≤ 0.001 (Student′s t-test). (G-R) Representative confocal images of double staining of cmyb RNA (red) and pH3 protein (green) in the CHT at 3 dpf. G, K and O are bright-field images overlaid with fluorescent staining. Scale bars, 50 µm. PHENOTYPE:
|
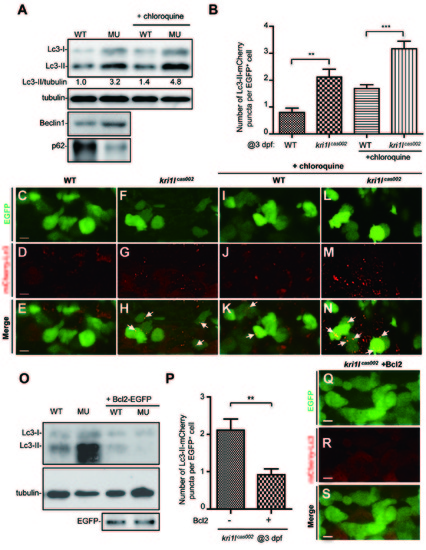
Ectopic expression of Bcl2 inhibits excessive autophagic flux in kri1lcas002 HSPCs. (A) Representative immunoblotting images of Lc3-I, Lc3-II, Beclin1 and p62 in whole embryo lysates of wild-type (WT) and kri1lcas002 embryos at 3 dpf, treated with or without chloroquine (5 μM) for 6 h before harvest. Tubulin serves as the loading control. (B) Statistics of the average number of autophagosome (indicated by mCherry-Lc3 puncta) in kri1lcas002 mutant embryos and WT siblings with or without chloroquine treatment at 3 dpf. mCherry-Lc3 puncta are counted in over 20 EGFP+ cells (in cmyb:egfp background) per embryo, total 6-8 embryos under each condition. Without chloroquine treatment, P = 0.0040; with chloroquine treatment, P = 0.0008. Error bars represent SEM. **P ≤ 0.01; ***P ≤ 0.001 (Student’s t-test). (C-N) Representative confocal images of mCherry-Lc3 puncta (autophagosomes) in HSPCs of live zebrafish embryos. Wild type siblings or kri1lcas002 mutant embryos in the Tg (cmyb: egfp) transgenic background, were injected with mcherry-lc3 mRNA at one-cell stage and imaged at 3 dpf with or without pre-treatment with chloroquine (5 μM) for 6 h. Scale bars: 5 μm. (O) Immunoblotting analysis of whole embryo lysates from WT andkri1lcas002 mutant embryos with or without bcl2 mRNA injection. (P) Statistics of the average number of autophagosome for kri1lcas002 mutant embryos and wild type siblings with Bcl2 overexpression at 3 dpf. mCherry-Lc3 puncta are counted in over 20 EGFP+ (cmyb: egfp) cells per embryo, total 8-11 individual embryos. P = 0.0021. Error bars represent SEM. **P ≤ 0.01; ***P ≤ 0.001 (Student’s t-test). (Q-S) Representative confocal images of mCherry-Lc3 puncta (autophagosomes) in HSPCs of live zebrafish embryos with Bcl2 overexpression. Scale bars, 5 μm. PHENOTYPE:
|
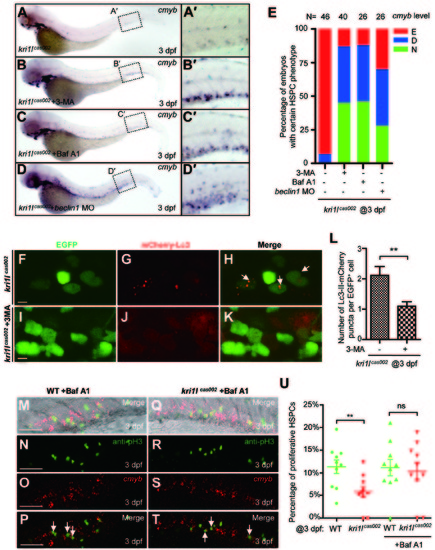
Autophagy inhibitors prevent hematopoiesis failure in kri1lcas002 mutant embryos. (A-D) Representative images of cmyb expression pattern in kri1lcas002 embryos with or without treatment of autophagy inhibitors, or with microinjection of beclin1 MO. kri1lcas002 embryos were treated with 3-MA (10 mM) or Baf A1 (25 nM) from 36 hpf to 72 hpf. After cmyb WISH and imaging, all embryos were genotyped; the percentage of the rescue was calculated. 18 out of 40 mutant embryos treated with 3-MA are fully rescued, while 17 out of 40 mutant embryos are rescued partially. 12 out of 26 mutant embryos treated with Baf A1 are fully rescued, while 11 out of 26 mutant embryos are rescued partially. 7 out of 26 mutant embryos injected beclin1 MO are fully rescued, while 11 out of 26 mutant embryos are rescued partially. (E) Percentage of kri1lcas002 mutant embryos with classified hematopoiesis phenotype with or without treatment of autophagy inhibitors, or with microinjection of beclin1 MO. (F-K) 3-MA inhibits excessive autophagy in HSPCs in kri1lcas002 mutant embryos. Representative confocal images of mCherry-Lc3 puncta (autophagosomes) in kri1lcas002 mutant embryos in Tg (cmyb:egfp) transgenic background are shown. Scale bars, 5 µm. (L) Quantitative analysis of F-K. The numbers of autophagosomes are decreased in kri1lcas002 embryos with 3-MA treatment, p = 0.0037. (M-T) Baf A1 treatment restores HSPCs proliferation in kri1lcas002 mutant embryos. Double staining of cmyb RNA (red) and phospho-histone 3 (pH3) protein (green) in the CHT region of embryos at 3 dpf. M and Q show bright-field images overlaid with fluorescent staining. Scale bars, 50 µm. (U) Percentage of proliferative HSPCs in the CHT of kri1lcas002 mutant embryos and wild type siblings with or without Baf A1 treatment at 3 dpf N = 10. Without Baf A1 treatment, p = 0.0014; with Baf A1 treatment, P = 0.2344. Error bars represent SEM. **P≤ 0.01; ***P ≤ 0.001 (Student′s t-test). EXPRESSION / LABELING:
PHENOTYPE:
|
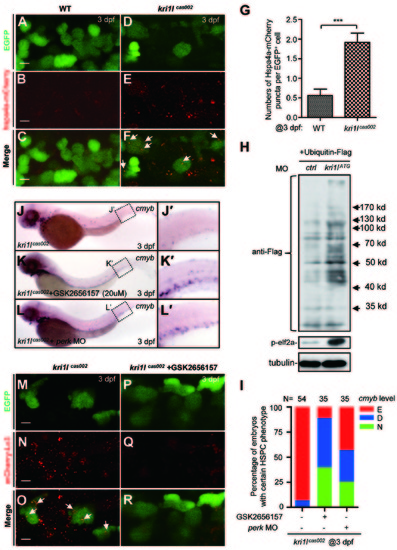
Accumulation of unfolded proteins and PERK activation leads to excessive autophagy and hematopoiesis failure. (A-G) Representative confocal images (A-F) and Quantitation (G) of Hspa4a-mCherry puncta (aggregation of misfolded protein) in HSPCs of live zebrafish embryos. Wild-type siblings or kri1lcas002 mutant embryos in the Tg (cmyb:egfp) transgenic background were injected with hspa4a-mcherry mRNA at one-cell stage and imaged at 3 dpf. The numbers of misfolded protein puncta are increased in kri1lcas002 embryos compared to that in wild-type siblings, P = 0.0002. Hspa4a-mCherry puncta were counted in over 30 EGFP+ cells (in the Tg (cmyb: egfp) background) per embryo, total 10-12 embryos. Error bars represent SEM. **P ≥ 0.01; ***P ≤ 0.001 (Student′s t-test). Scale bars, 5 µm. (H) Representative immunoblotting analysis of the level of protein ubiquitination and phospho-eif2a in whole embryo lysates of WT and kri1lcas002 embryos at 3 dpf injected with Flag-tagged ubiquitin plasmid at one-cell stage. Tubulin serves as the loading control. (I) Treatment with PERK inhibitor GSK2656157 or injection of perk MO rescues cmyb expression in HSPCs. Kri1lcas002 mutant embryos were treated with GSK2656157 (20 µM) from 36 hpf to 72 hpf, or injected with perk MO at one-cell stage. After WISH and imaging, all embryos were genotyped. 14 out of 35 mutant embryos treated with GSK2656157 are fully rescued, while 17 out of 35 mutant embryos are rescued partially. 9 out of 35 mutant embryos injected with perk MO are fully rescued, while 11 out of 35 mutant embryos are rescued partially. (J-L) Proportion of kri1lcas002 mutant embryos with classified hematopoiesis phenotype with or without GSK2656157 treatment, or with microinjection of perk MO. (M-R) GSK2656157 inhibits excessive autophagy in kri1lcas002 HSPCs. Representative confocal images of mCherry-Lc3 puncta (autophagosomes) in kri1lcas002 mutant embryos in Tg (cmyb:egfp) transgenic background are shown. Scale bars, 5 µm. |
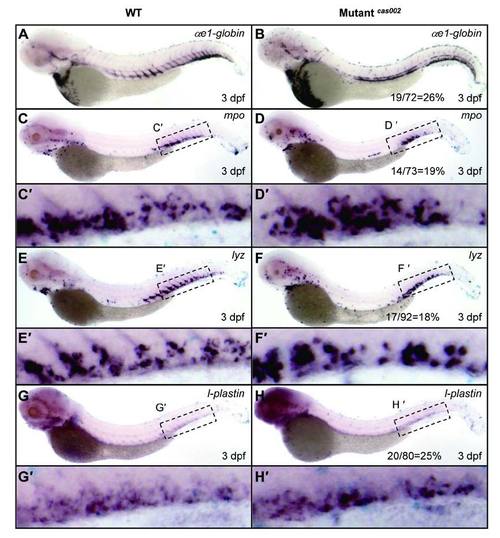
WISH analysis of hematopoietic lineages at 3 dpf. WT or mutantcas002 embryos were fixed at 3 dpf, followed by WISH analysis of the expression of αe1-globin, mpo, lyz, l-plastin, respectively. αe1-globin (A-B), mpo (C-D), lyz (E-F) and l-plastin (G-H) expression show no significant difference between siblings and mutantcas002 at 3 dpf. (C′-H′) enlarged CHT regions in C-H. The number of embryos in a het-het incross clutch with the expression pattern as shown in the mutantcas002 column and corresponding percentages are listed inside each panel. EXPRESSION / LABELING:
|
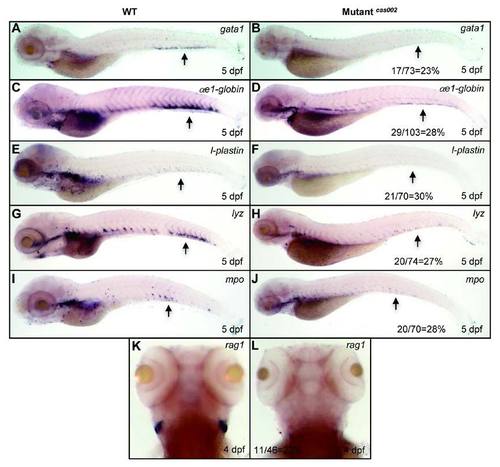
WISH analysis of hematopoietic lineages at 5 dpf. WISH assays for the expression pattern of gata1, αe1-globin, l-plastin, lyz and mpo in WT and mutantcas002 embryos at 5 dpf. Black arrows indicate CHT regions. T-lymphocyte marker rag1 decreases at 4 dpf in mutantcas002. The number and percentage of het-het incross embryos with the in situ pattern in a clutch are listed at the bottom of the Mutantcas002 panels. |
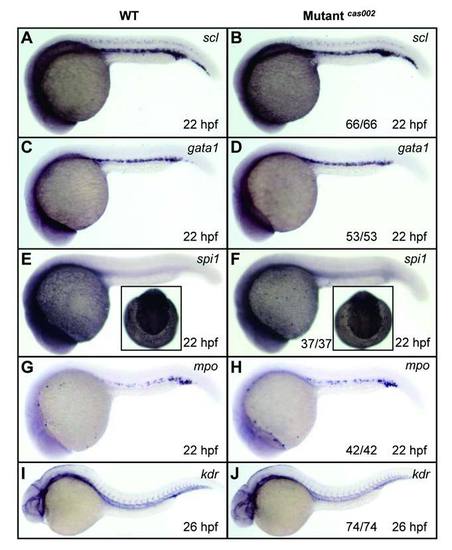
WISH analysis of primitive hematopoiesis and vascular morphogenesis. WT or mutantcas002 embryos were fixed at 22 hpf, followed by WISH analysis of scl, gata1, spi1, mpo expression. Expression of scl (A-B), gata1 (C-D), spi1 (E-F) and mpo (G-H) show no significant difference between wild-type siblings and mutants at 22 hpf. Insets in E-F show dorsal views of the head staining region. Embryos were fixed at 26 dpf, followed by WISH analysis of expression pattern of kdr. Expression of kdr (I-J), which marks vascular endothelial, had no significant difference between siblings and mutants at 26 hpf. The number and percentage of het-het incross embryos with the in situ pattern are listed at the bottom of the Mutantcas002 panels. PHENOTYPE:
|
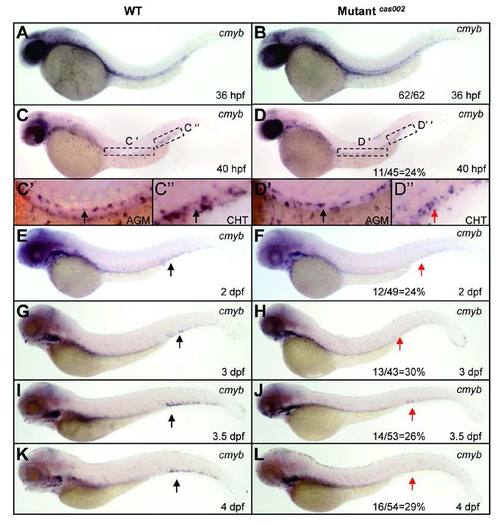
Analysis of cmyb expression in definitive hematopoiesis. Embryos were fixed at time point as indicated, followed by WISH analysis of cmyb expression. Expression of cmyb is shown in siblings and mutants at 36 hpf (A-B), 40 hpf (C-D), 2 dpf (E-F), 3 dpf (G-H), 3.5 dpf (I-J) and 4 dpf (K-L); (C′-D′) details of cmyb expression in the enlarged dotted AGM region at 40 hpf, (C′′-D′′) details of cmyb expression in the enlarged dotted CHT region at 40 hpf. Arrows indicate the HSPCs in hematopoietic regions of wild-type siblings (black) and mutantscas002 (red). The number and percentage of het-het incross embryos with the in situ pattern are listed at the bottom of the Mutantcas002 panels. |
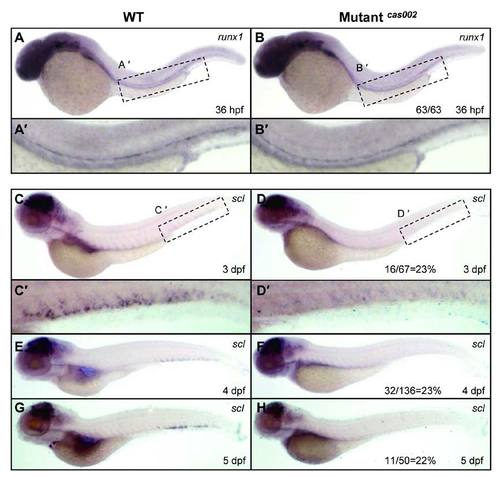
WISH analysis of runx1 and scl expression. Expression of runx1 has no significant difference between siblings and mutants at 36 hpf (A-B). (A′-B′) details of runx1 expression in the enlarged dotted AGM region. The expression of scl (C-H) in the CHT region of mutants decrease from 3 dpf to 5 dpf compared to that of wild-type siblings, similar to the changes of cmyb expression. (C′-D′) details of scl expression in the enlarged dotted CHT region. The number of embryos in a het-het incross with the expression pattern as shown in the mutantcas002 column and corresponding percentages are listed inside each panel. |
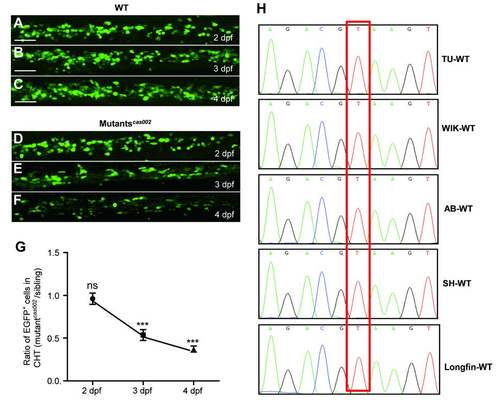
Mutantscas002 phenotype in Tg (cmyb:egfp) background. (A-F) Representative confocal images of EGFP+ cells in WT and mutantcas002 within Tg (cmyb: egfp) transgenic background. Scale bars: 50 μm. (G) Quantitative analysis of A-F. The number ofEGFP+ cells is comparable in mutant embryos at 2 dpf (p=0.7131). The numbers of EGFP+ cells are decreased in mutant embryos at 3 dpf (p<0.0001) and 4 dpf (p<0.0001). (H) Sequencing electropherogram of the mutation site of kri1l gene genomic DNA from 5 wild-type strains. Genomic DNA were extracted each from 20-30 embryos of TU, AB, WIK, Longfin and Shanghai strains, and were then sequenced for kri1l gene. This point mutation (T-G) in kri1lcas002 was not found in all five wild-type strains, indicating that T-G transition at the site is not a SNP. EXPRESSION / LABELING:
|
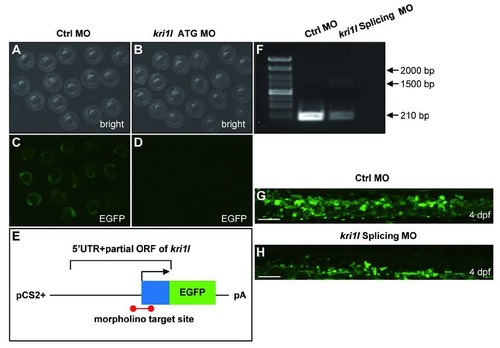
Validation of kri1l MO efficiency. (A-D) Bright field and fluorescent images of zebrafish embryos at 20 hpf after injection of kri1l (1-60)-GFP reporter mRNA and control MO or kri1l MO respectively at 1-cell stage. (E) Schematic presentation of the kri1l (1-60)-GFP reporter plasmid used to test the knockdown efficiency of MO. The 5′UTR and partial open reading frame (ORF) of kri1l gene depicted as the blue box was fused to the ATG-deleted open reading frame of EGFP shown as the green box in the pCS2+ plasmid. The red colored bar denotes the targeted site recognized by MO. (F) The efficiency assessment of kri1l splicing MO knockdown. PCR products for normal splicing fragment is 210 bp, the predicted abnormal splicing is around 1600 bp. Injection of kri1l splicing MO significantly decreases the level of normal kri1l mRNA. (G-H) Representative confocal images of EGFP+ cells in control morphants and morphants in the Tg(cmyb: egfp) background. Scale bars: 50 µm. The number of EGFP+ cells is decreased in kri1l morphants at 2 dpf (p=0.0001). Error bars represent standard error of the mean (SEM). **, P≤0.01; ***, P≤0.001 (Student t test). |
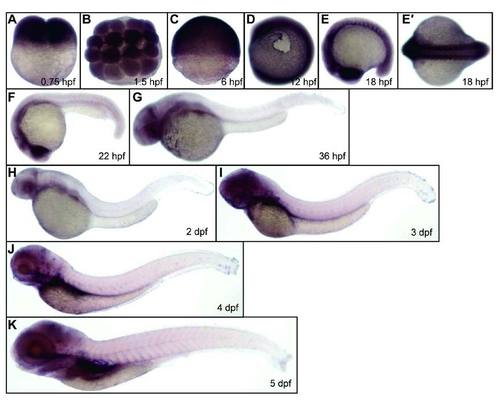
Expression of kri1l during zebrafish embryogenesis. WT (TU strain) embryos were fixed at the time points as indicated in each panel, followed by WISH analysis of kri1l expression. E′, a dorsal view of the embryos in E. |
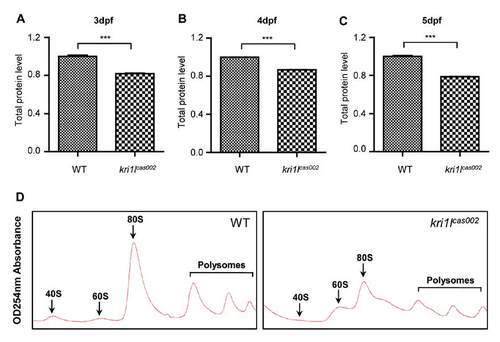
Analysis of total protein and polysome assembly in WT and kri1lcas002 embryos. (A-C) Total protein was extracted from lysates of deyolked whole embryos (n>20) and then measured by BCA (bicinchoninic acid) protein assay. The protein synthesis was impaired at 3 dpf (p=0.0003), 4 dpf (p<0.0001) and 5 dpf (p<0.0001). Error bars represent standard error of the mean (SEM). ***, P≤0.001 (Student t test). (D) Representative polysome fractionation analysis performed on WT and kri1lcas002 embryos at 3 dpf demonstrates reduced levels of 40 S ribosomal subunits, 80 S monosomes and polysomes; and excessive 60 S subunits in kri1lcas002 larvae compared to that in WT. PHENOTYPE:
|
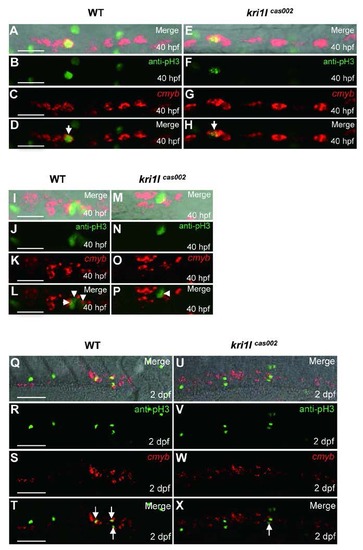
Defective HSPC proliferation in kri1lcas002 mutants. Representative confocal images of double staining of cmyb WISH (red) and phospho-Histene 3 immunostaining (green) in different time points and regions, including the AGM at 40 hpf (A-H) (A and E are bright-field images overlaid with fluorescent staining. Scale bars, 25 µm.); the CHT at 40 hpf (I-P) (I and M are bright-field images overlaid with fluorescent staining. Scale bars, 25 µm.), and at 2 dpf (Q-X) (Q and U are bright-field images overlaid with fluorescent staining. Scale bars, 50 µm.). |
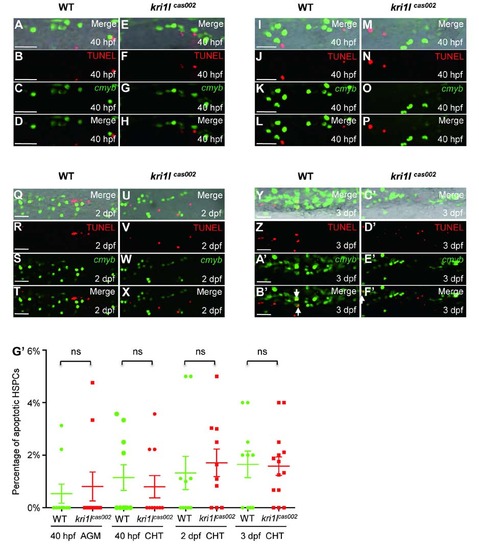
Percentage of apoptotic HSPC in kri1lcas002 mutants and WT siblings. Representative confocal images of kri1lcas002 mutants and WT siblings after TUNEL assays co-staining with EGFP antibody (in Tg(cmyb:egfp) background) in different time points and regions, including the AGM at 40 hpf (A-H) (A and E are bright-field images overlaid with fluorescent staining. Scale bars, 25 µm.); the CHT at 40 hpf (I-P) (I and M are bright-field images overlaid with fluorescent staining. Scale bars, 25 µm.), at 2 dpf (Q-X) (Q and U are bright-field images overlaid with fluorescent staining. Scale bars, 25 µm.), and at 3 dpf (Y-F′) (Y and C′ are bright-field images overlaid with fluorescent staining. Scale bars, 25 µm.). (G′) Statistic analysis of the apoptotic HSPC percentage (the proportion of apoptotic HSPC in total HSPCs) in kri1lcas002 mutants and wild-type siblings during hematopoietic development (40 hpf-3 dpf). Ne10 for each group. 40 hpf AGM, p=0.6824; 40 hpf CHT, p=0.5971; 2 dpf CHT, p=0.6433; 3dpf CHT, p=0.9122. Error bars represent standard error of the mean (SEM). **, P≤0.01; ***, P≤0.001 (Student t test). PHENOTYPE:
|
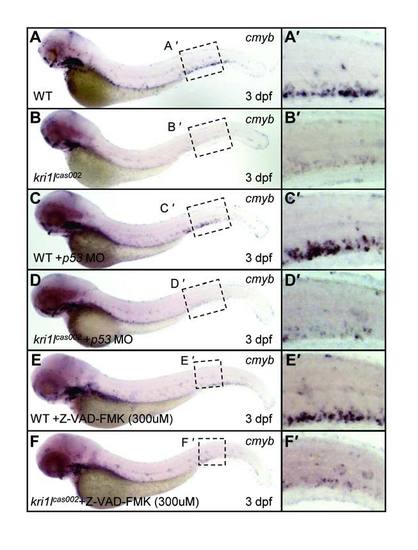
Knocking down p53 or pan-caspase inhibitor (Z-VAD-FMK) treatment cannot rescue HSPCs depletion phenotype in kri1lcas002 mutants. Expression level of cmyb were not restored in p53 MO-injected (A-D) or Z-VAD-FMK-treated kri1lcas002 mutants at 3 dpf (E-F). (A′-F′) the enlarged CHT regions. EXPRESSION / LABELING:
PHENOTYPE:
|
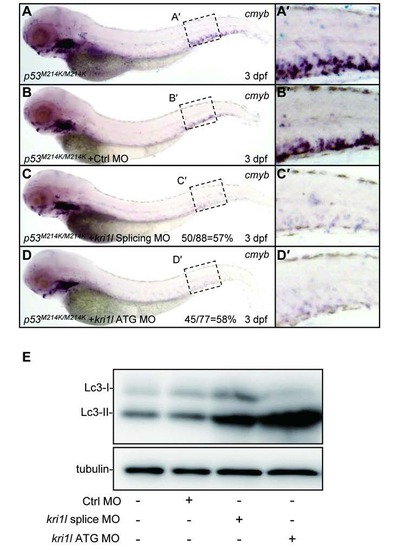
Inactivated p53 cannot rescue HSPCs depletion phenotype in kri1l morphants. (A-D) Expression level of cmyb in the CHT region was not restored in p53M214K/M214K mutants at 3 dpf with injection of kri1l splicing or ATG MOs at 1-cell stage. (A′-D′) details of cmyb expression in the enlarged CHT regions in A-D. (E) Immunoblotting analysis of Lc3 level in p53M214K/M214K mutants at 3 dpf, injected with control (Ctrl) and kri1l MO at 1-cell stage. EXPRESSION / LABELING:
PHENOTYPE:
|
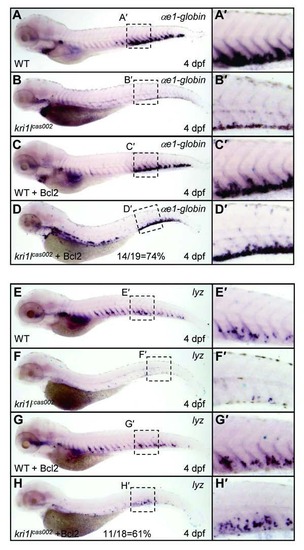
Bcl2 overexpression restored wild-type level of erythroid and myeloid lineages in kri1lcas002 mutants at 4 dpf. WT or kri1lcas002 mutants injected with bcl2 mRNA were fixed at 4 dpf, followed by WISH analysis of αe1-globin (A-D) and lyz (E-H) gene expression respectively. The rescue percentage of αe1-globin is about 74%, while the rescue percentage of lyz is about 61%. (A′-H′) the enlarged CHT regions. |
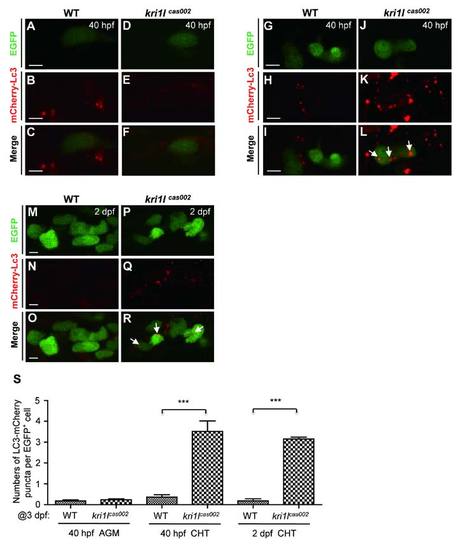
The comparison of autophagic level between kri1lcas002 mutants and wild-type siblings during hematopoietic development. Representative confocal images of mCherry–Lc3 puncta (autophagosomes) in HSPCs of live zebrafish embryos in different time points and regions, including the AGM at 40 hpf (A-F) (Scale bars: 5 µm.); the CHT at 40 hpf (G-L) (Scale bars: 5 µm.), and at 2 dpf (M-R) (Scale bars: 5 µm.). (S) Statistic analysis of the autophagy index (the average number of autophagosomes per HSPC) for kri1lcas002 mutants and wild-type siblings during hematopoietic development (40 hpf-2 dpf) mCherry–Lc3 puncta were counted over 20 EGFP+ cells (in the Tg(cmyb:egfp) background) in 5-8 individual embryos under each condition. 40 hpf AGM, p=0.4272; 40 hpf CHT, p<0.0001; 2 dpf CHT, p<0.0001. Error bars represent standard error of the mean (SEM). **, P0.01; ***, P≤0.001 (Student t test). |
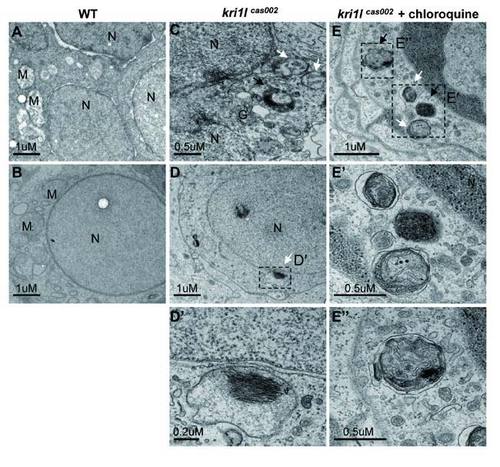
The cells in kri1lcas002 mutants contain autophagosome- and autolysome-like structures. Electron micrographs of 3 dpf embryos of WT (A-B), mutants (C-D) and mutants with chloroquine treated (E). White arrows indicate double-membrane autophagosomes, black arrows indicate autolysosomes. N = nucleus. M= Mitochondria. G= Golgi. Scale bars of A, B, D, and E: 1 µm. Scale bars of C, E′ and E′′: 0.5 µm. Scale bars of D′: 0.2 µm. PHENOTYPE:
|
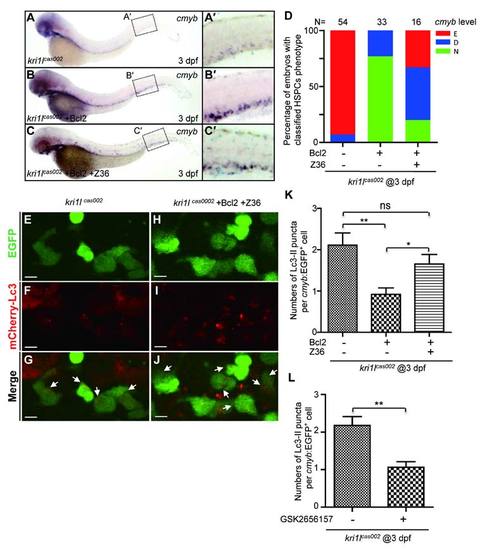
Z36 antagonizes Bcl2-mediated rescue effect on hematopoiesis defects in kri1lcas002 mutants. kri1lcas002 mutant embryos injected with bcl2 mRNA were treated with Z36 (10 µm) from 36 hpf for 36 hours. Hematopoietic phenotype was classified and quantified (D) based on cmyb WISH analysis and representative images are shown in (A-C). (E-J) Z36 recovers excessive autophagy in kri1lcas002 mutants injected with bcl2 mRNA. mCherry–Lc3 puncta were counted over 20 EGFP+ cells (in the Tg(cmyb:egfp) background) in 8-11 individual embryos. Quantitative results were summarized in (K). Error bars in K represent standard error of the mean (SEM). **, P≤0.01; ***, P≤0.001 (Student t test). Scale bars, 5 µm. (L) Quantitation of Lc3-mCherry+ autophagosome in Figure 6M-R. The number of autophagosome was decreased in kri1lcas002 embryos after GSK2656157 treatment, p=0.0091. |
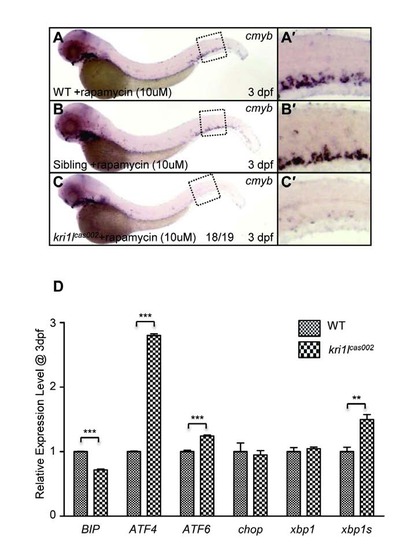
HSPCs phenotype in kri1lcas002 mutants is independent from mTOR pathway. (A-C) Defective cmyb expression at 3 dpf in kri1lcas002 mutants cannot be restored by rapamycin treatment. (A′-C′) the enlarged CHT regions. (D) The relative expression of BIP, ATF4, ATF6, Chop, Xbp1 and Xbp1s at 3 dpf in wild-type and kri1lcas002 mutants. Error bars represent standard error of the mean (SEM). **, P≤0.01; ***, P≤0.001 (Student t test). |
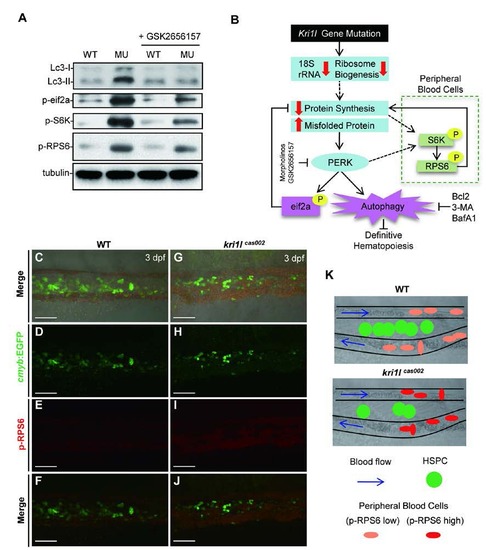
S6K signaling is activated mainly in peripheral blood cells in kri1lcas002 mutants. (A) Representative immunoblotting analysis of Lc3, phospho-eif2a, phos-RPS6 and phos-S6K in whole embryos lysates of WT and kri1lcas002 embryos at 3 dpf with or without GSK2656157 treatment. (B) Working model for kri1l dysfunction-induced excessive autophagy in HSPCs and erythrocytes through different pathways. In kri1lcas002 mutants, ribosome biogenesis is abnormal due to inadequate 18S rRNA. It will lead to the accumulation of misfolded protein and subsequent PERK activation, which can trigger excessive autophagy and disrupt definitive hematopoiesis. Injection of perk MO, treatment with PERK inhibitor GSK2656157 or autophagy inhibitors can successfully restore defective hematopoiesis in kri1lcas002 mutants. (C-J) Representative confocal images of phos-RPS6 in the Tg(cmyb: egfp) transgenic background. Double staining of phos-RPS6 (red) and EGFP in the CHT region of embryos at 3 dpf. C and G show bright-field images overlaid with fluorescent staining. Scale bars, 50 µm. (K) The model of CHT region, in WT embryos, HSPCs localize in CHT region between arteries and venous for transitory expansion and differentiation, erythrocytes in the circulation present low level of phospho-RPS6. In mutants, HSPCs seed in CHT but take a poor proliferation, erythrocytes in circulation present higher phospho-RPS6 level, indicating the activation of S6K is dominant in peripheral blood cells. |