
- Title
-
Differential expression of id genes and their potential regulator znf238 in zebrafish adult neural progenitor cells and neurons suggests distinct functions in adult neurogenesis
- Authors
- Diotel, N., Beil, T., Strähle, U., Rastegar, S.
- Source
- Full text @ Gene Expr. Patterns
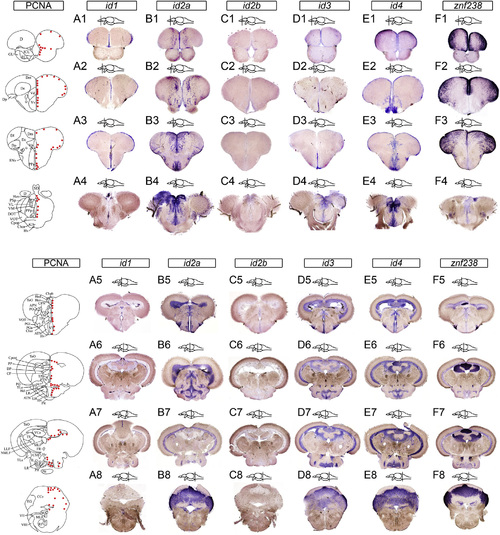
Id genes and znf238 expression in the brain of adult zebrafish. Id1, id2a, id2b, id3, id4 and znf238 in situ hybridization on transverse sections through the olfactory bulb/telencephalon junction (A1-F1), the telencephalon (A2-F2), the anterior (A3-F3) and posterior part (A4-F4) of the preoptic area, the anterior (A5-F5), the mediobasal (A6-F6) and the caudal (A7-F7) hypothalamus and through the medulla oblongata (A8-F8). A1 to F4: id1-id4 and znf238 expression in the anterior part of the brain, from the olfactory bulb/telencephalon junction to the end of the preoptic area. id1 as well as id3 is expressed along the brain ventricle. However, id3 is mainly detected in the subpallium. In contrast, id2a and id4 are more widely expressed and also found in the brain parenchyma. Id2b transcripts are hardly detected. znf238 is strongly expressed in the pallium, but the ventricular layer does not appear to be stained. A5 to F8: id1-id4 expression in the posterior part of the brain, from the hypothalamus to the medulla oblongata. Id1 staining is detected along the brain ventricles notably at the level of the hypothalamus and optic tectum. In contrast id2a, id3 and id4 transcripts are widely expressed in ventricular and periventricular layers of the neurogenic regions and also in the brain parenchyma. Their expression appears more or less ubiquitous. Similarly to the anterior part of the brain, id2b transcripts are hardly detectable. znf238 is strongly expressed in the valvula of the cerebellum and the cerebellum, and shows weak expression in the hypothalamus. Red dots in the zebrafish section schemes correspond to proliferative areas, which are indicated based on PCNA expression. Bars: 200 µm (A1 to F4); 280 µm (A8 to F8); 300 µm (A5 to F7). EXPRESSION / LABELING:
|

id1 and id2a expression in neural progenitors. A to L: PCNA (blue) and S100β (green) immunohistochemistry in the telencephalon of transgenic Tg(id1:EGFP) fish (GFP artificially put in red). Id1 transgene is expressed in type 1 (S100β-positive and PCNA-negative) and in type 2 (S100β and PCNA-positive) radial glial cells. E to H: high magnification views of the upper white box in D corresponding to the Dm region. Id1 transgene is strongly expressed in type 1 cells (arrows) and weakly or not by type 2 cells (arrowhead). I to L: high magnification views of the lower white box in D corresponding to the rostral migratory stream like region (RMS) region. Type 3 progenitors (S100β-negative and PCNA-positive) of the RMS do not express id1 (asterisks). M to X: id2a in situ hybridization (red) followed by PCNA (blue) and S100β (green) immunohistochemistry in the telencephalon. Id2a mRNA appears to be widely expressed in the telencephalon, in the parenchyma and the ventricular layer. Q to T: high magnification views of the upper white box in P corresponding to the Dm region. The arrows show an example of a type 1 progenitors (S100β and PCNA-negative) expressing id2a, while the arrowhead shows a type 2 progenitor (S100β-positive and PCNA-positive) exhibiting id2a expression. U to X: high magnification views of the lower white box in P corresponding to the RMS region. The asterisk shows an example of a type 3 progenitor (S100 β -negative and PCNA-positive) of the rostral migratory stream like region (RMS), expressing id2a transcripts. Scale bar: 8 µm (Q to T); 12 µm (I to L); 20 µm (U to X); 25 µm (E to H); 250 µm (A to D); 310 µm (M to P). EXPRESSION / LABELING:
|

Strong id3 expression in type 3 progenitors and weak id4 expression in neural progenitors. A to L: id3 in situ hybridization (red) followed by PCNA (blue) and S100β (green) immunohistochemistry in the telencephalon. Id3 appears to be mainly and strongly expressed in the ventricular layer of the subpallium. E to H: high magnification views of the upper white box in D corresponding to the Dm region. A weak id3 expression is detected in non-proliferative (arrow) and proliferative (arrowhead) S100β-positive radial glial cells (type 1 and type 2 cells, respectively). I to L: high magnification views of the lower white box in D corresponding to the rostral migratory stream like region (RMS) region. The asterisks show a strong id3 expression in type 3 progenitors (S100β-negative and PCNA-positive) of the RMS. M to X: id4 in situ hybridization (red) followed by PCNA (blue) and S100β (green) immunohistochemistry in the telencephalon. id4 expression appears to be widely expressed in the parenchyma but not in the ventricular layer. Q to T: high magnification views of the upper white box in D corresponding to the Dm region. id4 transcripts are mainly absent from non-proliferative (arrow) and proliferative (arrowhead) S100β-positive radial glial cells (type 1 and type 2 cells, respectively). U to X: high magnification views of the lower white box in P corresponding to the RMS region. In the RMS, id4 expression is barely detected in type 3 progenitor (S100β-negative and PCNA-positive) as shown with asterisks. Scale bar: 15 µm (I to L); 20 µm (U to X); 35 µm (Q to T); 40 µm (E to H); 130 µm (M to P); 250 µm (A to D). EXPRESSION / LABELING:
|
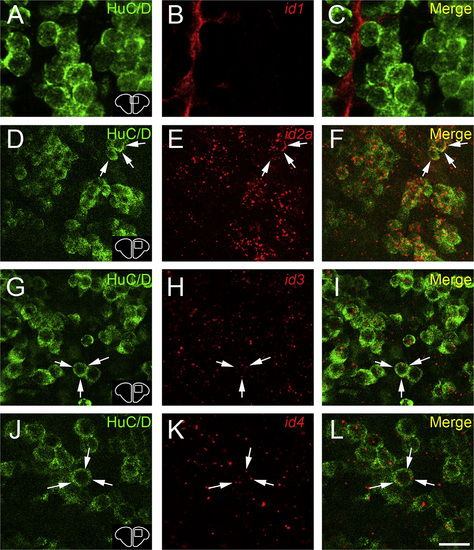
id2a, Id3 and Id4 expression in HuC/D-positive neurons. A to L: Anti-GFP immunohistochemical staining on Tg(id1:EGFP) fish (GFP artificially put in red) and id2a, id3 and id4 in situ hybridization on WT fish (red) followed by HuC/D immunohistochemistry (green). The arrows show id2a, id3 and id4 mRNAs detection in HuC/D-positive neurons. The id1 transgene is not detected in neurons. Scale bar: 7 µm (A to C); 16 µm (D to I); 11 µm (J to L). EXPRESSION / LABELING:
|

znf238 is not expressed in radial glial cells but in neurons. A to I: znf238 in situ hybridization (red) followed by S100β (green) immunohistochemistry in the telencephalon. D to F: high magnification views of the corresponding white boxes in A to C. The arrows show that the S100β-positive radial glial cells do not express (or only barely for few of them) znf238 mRNA in the dorsomedian telencephalon. J to L: znf238 in situ hybridization (red) followed by HuC/D (green) immunohistochemistry in the telencephalon. Znf238 transcripts were detected in HuC/D-positive neurons (arrows) Scale bar: 12 µm (J to L); 20 µm (D to I); 70 µm (A to C). EXPRESSION / LABELING:
|

id2a, id3 and id4 are expressed in znf238-positive cells, but not id1. A to D: Double fluorescent in situ hybridization in the pallium showing id1, id2a, id3 and id4 transcripts in red and znf238 mRNA in green. Id1 transcripts are not detected in znf238 expressing cells (arrowheads), while id2a, id3 and id4 transcripts are expressed in znf238 positive cells (arrows). Scale bar: 6 µm (D); 12 µm (B to C); 35 µm (A). EXPRESSION / LABELING:
|

Reprinted from Gene expression patterns : GEP, 19(1-2), Diotel, N., Beil, T., Strähle, U., Rastegar, S., Differential expression of id genes and their potential regulator znf238 in zebrafish adult neural progenitor cells and neurons suggests distinct functions in adult neurogenesis, 1-13, Copyright (2015) with permission from Elsevier. Full text @ Gene Expr. Patterns