
- Title
-
Vascular Mural Cells Promote Noradrenergic Differentiation of Embryonic Sympathetic Neurons
- Authors
- Fortuna, V., Pardanaud, L., Brunet, I., Ola, R., Ristori, E., Santoro, M.M., Nicoli, S., Eichmann, A.
- Source
- Full text @ Cell Rep.

SNs Develop Next to the DA in Zebrafish Embryos (A–C) Dorsal views (anterior is to the left) of whole-mount Tg(kdrl:EGFP)la116 zebrafish embryos between the LDA (arrowheads) and DA connection and the glomerular region (G) at the indicated time points. Immunostaining with antibodies to detect GFP (vessels, green), Hu C/D (post-mitotic neurons, red), and tyrosine hydroxylase enzyme (TH) (catecholaminergic marker, blue). (A and B) HU+/TH+ SNs are pseudocolored in white (arrows) in the merged confocal images. (C) Brackets mark the three clusters (rostral, glomerular, and trunk) of SNs organized around DA. (D) Quantification of total number of double HU+/TH+ cells at 48, 60, and 72 hpf. (E) Quantification of double HU+/TH+ cells organized in three clusters around the DA at 48 and 72 hpf. Data were calculated from three independent experiments. NS, not significant; error bars indicate SD. DA, dorsal aorta; LDA, lateral dorsal aorta; AA, aortic arch; G, glomerulus; hpf, hours post-fertilization. Scale bars, 75 µm (A–C). See also Figure S1>. |
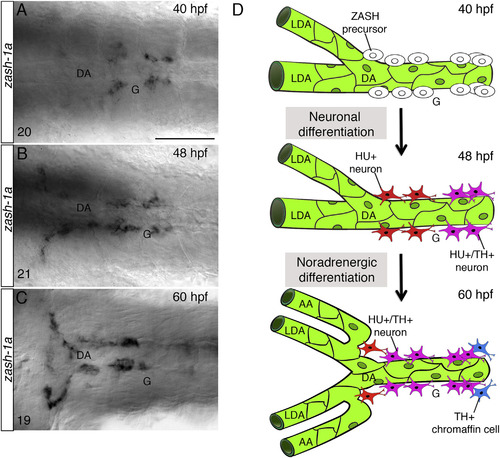
Early SN Precursors Develop Next to the DA (A–C) Whole-mount in situ hybridizations with antisense riboprobe specific for zash-1a RNA expression at the indicated time points. Images are ventral views (anterior is to the left) of the region between the LDA-DA connection (left) and the glomerular region (G) after dissection of the yolk sac. Zash-1a+ sympathetic precursors are present around the DA at 40 hpf (A). At 48 hpf (B) and 60 hpf (C), zash-1a expression expands to more anterior and posterior regions. The number of embryos observed is indicated at the bottom left. (D) Schematic representation of SN development. At 40 hpf, zash-1a+ sympathetic precursors differentiate next to the DA. At 48 hpf, they acquire HU expression and some of them become TH+. At 60 hpf, most of them have acquired TH expression. DA, dorsal aorta; LDA, lateral dorsal aorta; AA, aortic arch; G, glomerulus; hpf, hours post-fertilization. Scale bar, 75 µm (A–C). See also Figure S2. |

Absence of Blood Flow Perturbs Vascular Maturation and SN Differentiation (A, B, D, and E) Confocal images of control (A and D) or tnnt2 morpholino-injected (B and E) Tg(kdrl:EGFP)la116 zebrafish embryos immunostained for GFP (green), HU (red), and TH (blue). Dorsal views (anterior is to the left). HU+/TH+ SNs are pseudocolored in white and indicated (arrows). Tnnt2 morphants display defective remodeling of the LDA-DA and misalignment of HU+/TH+ neurons. (C and F) Quantification of SNs (HU+/TH+) in control and tnnt2 morpholino-injected embryos at 48 (C) and 60 hpf (F). Data were calculated from three independent experiments. NS, not significant; error bars indicate SD. Hpf, hours post-fertilization. Scale bar, 50 µm (A, B, D, and E). |
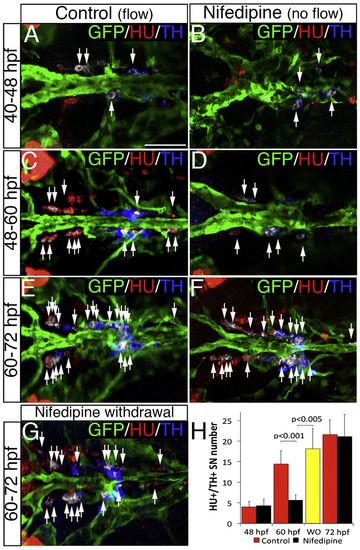
NA Differentiation of SNs Requires Blood Flow (A–F) Dorsal views (anterior is to the left) of control (A, C, and E) or nifedipine-treated (B, D, and F) Tg(kdrl:EGFP)la116 zebrafish embryos. HU+/TH+ SNs are pseudocolored in white and indicated (arrows). Nifedipine was used to arrest blood flow during the periods indicated on the left. Treatment with 40 µM Nifedipine from 40–48 hpf or from 60–72 hpf does not affect the NA differentiation of SNs (A, B, E, F, and H). Nifedipine treatment from 48 to 60 hpf significantly decreases NA differentiation of SNs (C, D, and H). (G) After nifedipine exposure between 48 and 60 hpf, the drug was withdrawn and embryos were maintained in control conditions for an additional 12 hr (60–72 hpf). NA differentiation recovered following nifedipine withdrawal. (H) Quantification of HU+/ TH+ SNs in control (red bars), nifedipine-treated (black bars), and nifedipine-withdrawal (WO) (yellow bar) embryos. Data were calculated from three independent experiments. Error bars indicate SD. Hpf, hours post-fertilization. Scale bar, 50 µm (A–G). See also Figure S3. |
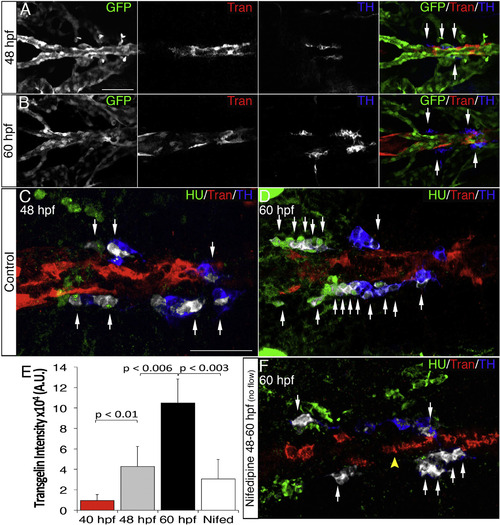
Blood Flow Triggers VMC Coverage and NA Differentiation (A and B) Dorsal views (anterior is to the left) of whole-mount Tg(kdrl:EGFP)la116 zebrafish embryos immunostained with antibodies to detect GFP (endothelial cells, green), Transgelin (vascular mural cells, red), and TH (blue) at 48 (A) and 60 hpf (B). (A and B) Note appearance of Transgelin+ VMCs next to TH+ cells (arrows). (C and D) HU+/TH+ SNs (pseudocolored white) are next to VMCs (Transgelin+, red) at 48 (C) and 60 hpf (D). (E) Quantification of total Transgelin fluorescence intensity in control or 40 µM nifedipine-treated embryos. A.U., arbitrary units. Data were calculated from three independent experiments. Error bars indicate SD. (F) Confocal images of Tg(kdrl:EGFP)la116 zebrafish embryos treated with 40 µM nifedipine for 12 hr starting at 48 hpf and immunostained for HU (green), Transgelin (red), and TH (blue). Note reduced VMC coverage and lower numbers of HU+/TH+ SNs. Scale bars, 75 µm (A–F). See also Figure S4. |
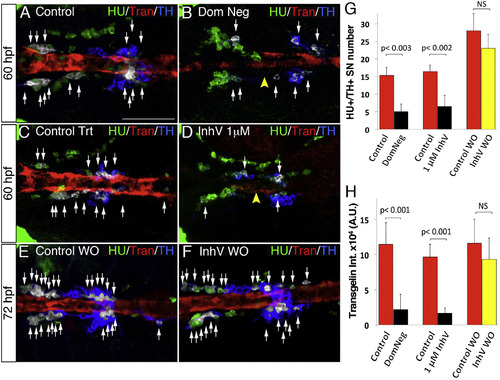
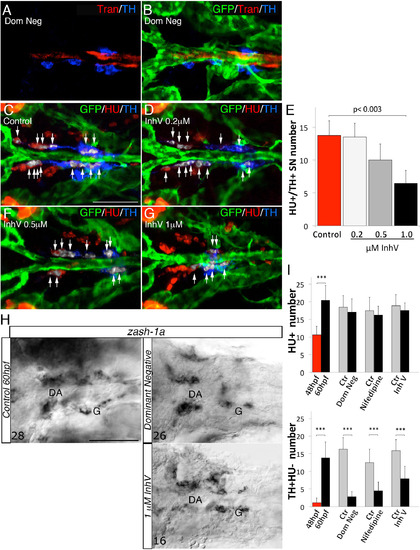
PDGF Inhibition Affects VMC Coverage and NA Differentiation (A–F) Confocal analysis of Tg(kdrl:EGFP)la116 zebrafish embryos at the times indicated in the lateral panel and immunostained for HU (green), Transgelin (red), and TH (blue). Dorsal views (anterior is to the left). Arrows indicate white pseudocolored HU+/TH+ SNs. (A and B) Heat-shock embryos negative for dnPDGFRβ -YFP expression (A) and those heat-shock-induced embryos transiently expressing dnPDGFR²-YFP (B) at 60 hpf. Arrowhead indicates the reduced VMC coverage in positive dnPDGFRβ-YFP embryos. (C and D) Control embryos treated with DMSO (C) or 1 µM of PDGFR inhibitor InhV (D) between 48 and 60 hpf. Arrowhead indicates the reduced VMC coverage in PDGFR inhibitor-treated embryos. Note presence of HU+ cells but few HU+/TH+ SNs (D). (E and F) After 1 µM InhV exposure between 48 and 60 hpf, the drug was withdrawn and embryos were maintained in control conditions for an additional 12 hr (60–72 hpf). NA differentiation recovered following InhV withdrawal. (G) Quantitative analysis of HU+/TH+ SNs. (H) Quantitative analysis of Transgelin fluorescence intensity. Data were calculated from three independent experiments. NS, not significant; error bars indicate SD. A.U., arbitrary units; hpf, hours post-fertilization. Scale bar, 75 µm (A–F). See also Figure S5. |
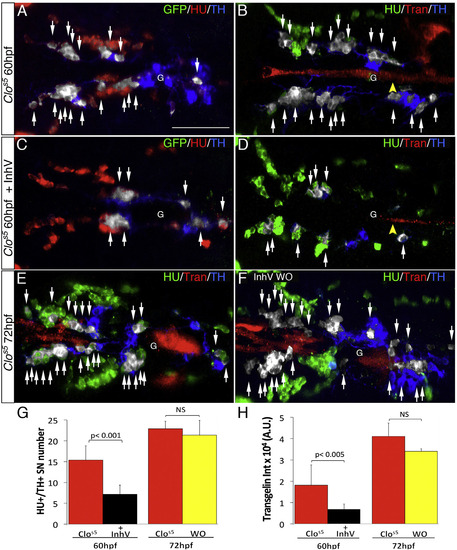
Ectopic VMCs in clos5 Embryos Are Sufficient to Induce NA Differentiation (A–F) Confocal analysis of clos5Tg(kdrl:EGFP) embryos. Dorsal views of the region between the LDA and the glomerulus (anterior is to the left). HU+/TH+ SNs are pseudocolored in white and indicated (arrows). (A and B) SNs develop in clos5 mutant embryos in the absence of endothelial cells (A) and the presence of VMCs (B). Arrowhead indicates VMC coverage in clos5 mutant embryos. (C and D) clos5 embryos treated with 1 µM of PDGFR inhibitor InhV (D) or DMSO (C) between 48 and 60 hpf. Arrowhead indicates the reduced VMC coverage in clos5 PDGFR inhibitor-treated embryos (D). Note presence of HU+ cells but fewer HU+/TH+ SNs (white arrows) in clos5 embryos treated with 1 µM PDGFR inhibitor. (E and F) clos5 embryos treated with 1 µM of PDGFR inhibitor InhV between 48 and 60 hpf were maintained in control conditions for an additional 12 hr (60–72 hpf). SN morphogenesis and NA differentiation recovered following InhV withdrawal (F). (G) Quantification of HU+/TH+ SNs in clos5 mutant embryos. (H) Quantitative analysis of Transgelin fluorescence intensity of the clos5 mutant embryos. Data were calculated from three independent experiments. NS, not significant; error bars indicate SD. A.U., arbitrary units; G, glomerulus; hpf, hours post-fertilization. Scale bar, 75 µm (A–F). See also Figure S6. |
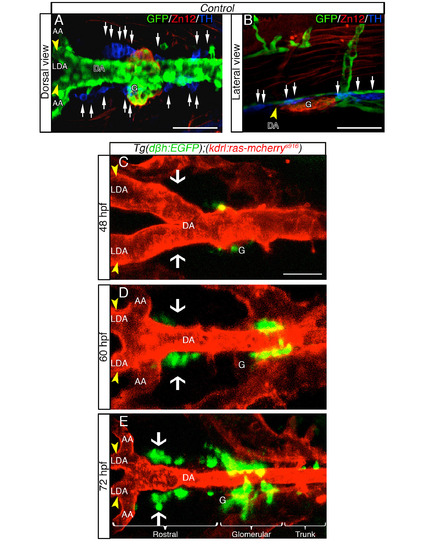
DβH-positive cells develop in proximity to the DA in live zebrafish embryos, related to Figure 1. (A, B) TH+ expressing cells are dispersed as several clusters between the LDA (arrowhead) - DA connection and the glomerular region (G). Dorsal (A) and lateral (B) views (anterior is to the left) of whole-mount 60hpf Tg(kdrl:EGFP)la116 zebrafish embryos. Tg(kdrl:EGFP)la116 zebrafish embryos immunostained with antibodies to detect GFP (vessels, green), ZN12 (glomerulus, red) and Tyrosine Hydroxylase enzyme (TH) (catecholaminergic marker, blue). (C-E) Live confocal fluorescence images (dorsal view) of Tg(dβh:EGFP);(kdrl:ras-mcherry)s916 embryos between the LDA (arrowhead) - DA connection and the glomerular region (G) at indicated stages. Anterior is to the left. (C) DβH-positive cells (green) are first detected at 48 hpf. (D) Between 48 - 60 hpf, DβH-positive cells develop in loco (white arrows) and close to the LDA-DA connection, while a new vessel (AA) is formed with LDA. (E) EGFPpositive cells are organized in three clusters (rostral, glomerular and trunk) around DA. The number of DβH-positive cells increase both rostrally and caudally along DA from 48 to 72 hpf. Data were calculated from three independent experiments. N.S., not significant; error bars indicate SD. DA, dorsal aorta; LDA, lateral dorsal aorta; AA, aortic arch; G, glomerulus; hpf, hours postfertilization. Scale bar: 75 µm in A; 50 µm in B-E. |
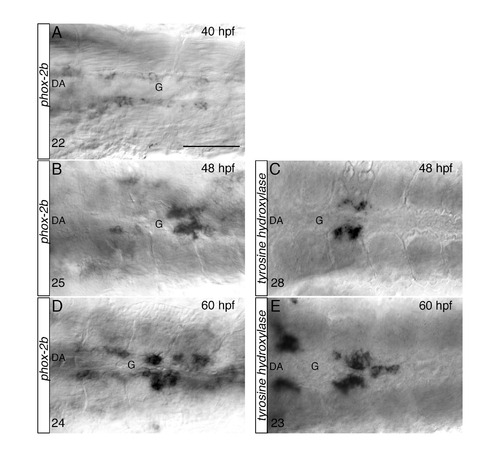
Stepwise differentiation of SNs next to the DA, related to Figure 2. (AE) Whole-mount in situ hybridizations with antisense riboprobes specific for phox-2b (A, B, D) and tyrosine hydroxylase (th) (C, E) at the indicated time points. Images are ventral views (anterior is to the left) of the region between LDA-DA connection (left) and the glomerular region (G) after dissection of the yolk sac. Phox-2b positive sympathetic precursors are present around the DA at 40 hpf (A), before th+ RNA expressing cells appear at 48 hpf (C). Phox-2b and th expressions patterns expand to more anterior and posterior regions at 60 hpf (D, E). The number of embryos observed is indicated at the bottom left. Scale bar: 75 µm in A-E. |
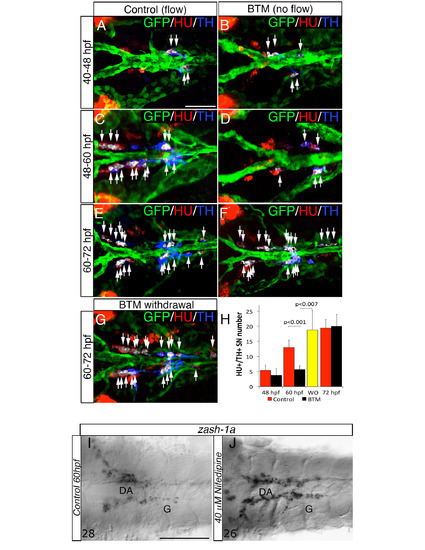
Blood flow is required at specific stages to induce NA differentiation of SNs, related to Figure 4. (A-F) Dorsal views (anterior to the left) of control- (A, C, E) or 2,3 Butanedione monoxime (BTM)-treated (B, D, F) Tg(kdrl:EGFP)la116 zebrafish embryos. HU+/TH+ SNs are pseudocolored in white and indicated (arrows). BTM was used to stop the blood flow between the stages indicated on the left. Embryos exposed to 20 mM BTM from 48 to 60 hpf (C-D) show severe interruption of the NA differentiation of SNs. BTM treatment from 40 - 48 hpf or from 60 - 72 hpf does not affect the NA differentiation of SNs (A-B, E-F). (G) After BTM exposure between 48 – 60 hpf, the drug was withdrawn and embryos were maintained under control conditions for an additional 12h (60-72 hpf). NA differentiation recovered following BTM withdrawal. (H) Quantitative analysis of HU+/ TH+ SNs in control- (red bars), BTM -treated (black bars) and BTM withdrawal (WO) (yellow bar) embryos. Data were calculated from three independent experiments. N.S., not significant; error bars indicate SD. (I, J) Whole-mount in situ hybridizations with antisense riboprobe specific for zash-1a RNA in control (I) and embryos treated with Nifedipine between 48 and 60 hpf (J). Images are ventral views (anterior is to the left) of the region between LDA-DA connection (left) and the glomerular region (G) after dissection of the yolk sac. Nifedipine did not affect Zash-1a positive sympathetic precursors. Numbers of analyzed embryos are indicated. Scale bars: 50 µm in A-G, 75 µm in I,J. |
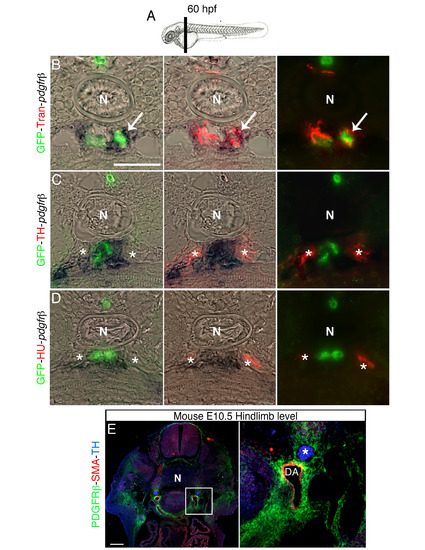
Pdgfr-β expression co-localizes with perivascular Transgelin positive cells, related to Figure 5. (A) Schematic representation of section plane in B-D. (B-D) Transversal section of 60 hpf Tg(kdrl:EGFP)la116 zebrafish embryos at the level of the vertical black bar in A. Embryos were analyzed for Pdgfr-β expression by in situ hybridization and immunostained with antibodies to detect GFP (vessels), Transgelin (Tran) (VMCs), Hu and TH. (B) Transgelin and pdgfr-β expression are co-localized in perivascular area (arrow). (C, D) pdgfr-β expressing cell do not co-localize with TH+ and HU+ cells (indicated by asterisk). (E) Transverse section of mouse embryo immunostained with antibodies against PDGFRβ (green), SMA (red) and TH (blue). Right panel shows magnification of the boxed area in left panel. PDGFRβ is expressed in VMCs, but not in SNs (asterisk). DA, dorsal aorta; N, notochord. Scale bars: 50 µm in B-E. |
Interference with VMC recruitment does not affect HU+ cells and zash- 1a expression, related to Figure 6. (A-B) 60 hpf Tg(kdrl:EGFP)la116 zebrafish embryos injected with dnpdgfrβ-YFP and heat shocked at 24 hpf. Dorsal views (anterior is to the left). GFP, Trans and HU antibodies staining indicate that the treatment did not block vessel formation or blood flow but reduced number of Tran and TH positive cells compared to embryos heat shocked at 20 hpf and negative for dnPDGFRβ-YFP (see Fig. 6A). (C-D, F-G) Confocal analysis of control Tg(kdrl:EGFP)la116 zebrafish embryos (C) and embryos treated with increasing concentrations of PDGFR inhibitor InhV (D, F, G) and immunostained for GFP (green), HU (red) and TH (blue). Treatment with 1 µM InhV between 48 and 60hpf did not block vessel morphology and formation. Note presence of HU+ cells but absence of HU+/TH+ SNs (pseudocolored white) in embryos treated with 1 µM inhibitor (G). (E) Quantification of HU+/TH+ SNs in control- and PDGFR inhibitor-treated embryos. (H) Whole-mount in situ hybridizations with antisense riboprobe specific for zash-1a RNA expression at the indicated treatment conditions. Images are ventral views (anterior is to the left) of the region between LDA-DA connection (left) and the glomerular region (G) after dissection of the yolk sac. Zash-1a positive sympathetic ganglionic precursors around the DA were not blocked by treatments that interfered with VMC recruitment at 60hpf. Numbers of analyzed embryos are indicated. (I) Quantitative analysis of HU+ cells and Hu-/TH+ cells after different treatments that interfered with VMC recruitment. Note that HU+ cell number is not disturbed by transient expression of dnpdgfrβ-YFP or 1 µM InhV, while the number of Hu-/TH+ cells is reduced. Data were calculated from three independent experiments. N.S., not significant; error bars indicate SD. DA, dorsal aorta; G, glomerulus, hpf, hours postfertilization. Scale bar: 75 µm in A-D, F-H. See also Figure 6. |
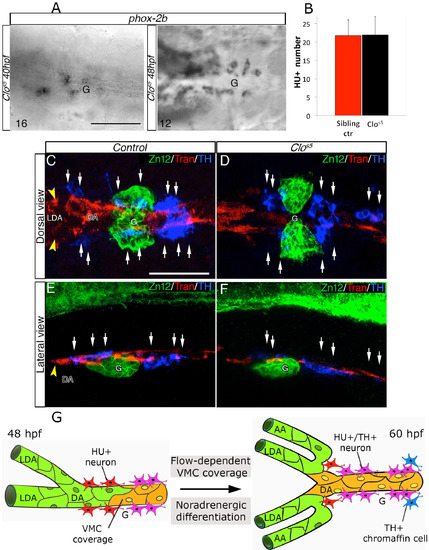
SN differentiation in clos5 mutants, related to Figure 7. (A) Phox-2b RNA expression was analyzed in clos5 Tg(kdrl:EGFP) embryos by in situ hybridizations at the indicated developmental stages. Images are ventral views (anterior is to the left) around the glomerular region (G) after dissection of the yolk sac. Phox-2b positive sympathetic precursors are present around the DA at 40 and 48 hpf. The number of embryos observed is indicated at the bottom left. (B) Quantitative analysis of HU+ cells in Tg(kdrl:EGFP) control embryos and clos5 littermates at 60 hpf. Data were calculated from three independent experiments, error bars indicate SD. (C-F) Confocal analysis of control- (C, E) or clos5 (D, F) Tg(kdrl:EGFP) embryos. Dorsal (C, D) and lateral (E, F) views of the region around the glomerulus, anterior is to the left. Embryos are immunostained with antibodies to detect ZN12 (glomerulus, green), Transgelin (Tran) (red) and TH (blue). Note that SNs (white arrows) are present in proximity to VMCs in control and clos5 littermates. Scale bars: 75 µm in A-E. (G) Model for DA-mediated NA differentiation of SNs. Between 48 – 60 hpf, arterial vessels (LDA-DA connection) undergo angiogenic remodeling. Blood flow and PDGFR signaling enhance VMCs (yellow) recruitment around remodeling vessels. HU+ post-mitotic neurons (red) differentiate into NA neurons (HU+/TH+) (pink) in parallel with VMC differentiation. Fully differentiated SNs are detected in proximity to newly VMC-covered arterial vessels at 60hpf. DA, dorsal aorta; LDA, lateral dorsal aorta; AA, aortic arch; G, glomerulus; VMC, Vascular mural cells. |

NA Differentiation and VMC Coverage in Mouse and Quail Embryos, related to Figure 7. (A-D) Transverse sections of quail (A) and mouse (B-D) embryos immunostained with antibodies against SMA (A-C, red), NG2 (D, orange) and TH (A-D, green). Note close proximity of TH+ SNs (arrows) and SMA-covered regions of the DA (B), but presence of TH+ aggregates in SMA-negative regions of the DA (C) in more posterior sections of the same embryo. Further analysis of consecutive serial sections shows these areas are already covered with NG2+ immature VMCs (D). DA; dorsal aorta; Scale bar: 50 µm in A-D. |