
- Title
-
Poised Regeneration of Zebrafish Melanocytes Involves Direct Differentiation and Concurrent Replenishment of Tissue-Resident Progenitor Cells
- Authors
- Iyengar, S., Kasheta, M., Ceol, C.J.
- Source
- Full text @ Dev. Cell
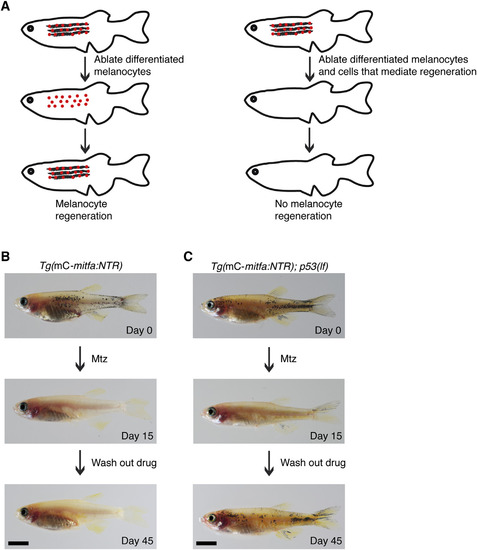
Melanocyte Regeneration in Adult Zebrafish Requires mitfa-Expressing Cells (A) Strategy for identifying cells that mediate melanocyte regeneration: promoter-based ablation of only differentiated melanocytes results in regeneration (left) whereas promoter-based ablation of differentiated melanocytes and cells that mediate melanocyte regeneration causes failure of regeneration (right). (B) Adult zebrafish expressing mitfa:NTR in miniCoopR-rescued melanocytes and lineally related cells (top). Differentiated melanocytes were ablated upon Mtz treatment (middle) but failed to regenerate after Mtz was washed out (bottom). n = 5 fish; representative images are shown. mC, miniCoopR. Scale bar, 5 mm. (C) Adult p53(lf) zebrafish expressing miniCoopR-mitfa:NTR (top). Differentiated melanocytes were ablated on Mtz treatment (middle), and new melanocytes regenerated after Mtz was washed out (bottom). n = 5 fish; representative images are shown. mC, miniCoopR. Scale bar, 5 mm. See also Figure S1 and Movies S1 and S2. |
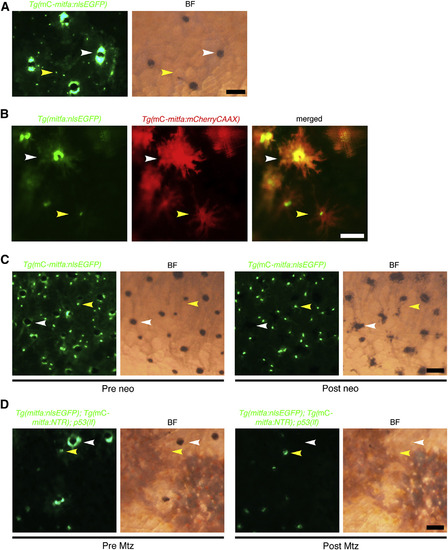
Unpigmented mitfa-Expressing Cells Are Present at the Onset of Regeneration (A) Flank of adult zebrafish expressing miniCoopR-mitfa:nlsEGFP. Unpigmented nlsEGFP-positive nuclei (yellow arrowheads) were admixed with nuclei of differentiated melanocytes (white arrowheads). mC, miniCoopR; BF, brightfield. Scale bar, 100 µM. (B) Flank of adult zebrafish coexpressing mitfa:nlsEGFP and miniCoopR-mitfa:mCherryCAAX. Unpigmented cells with nlsEGFP-positive nuclei (yellow arrowheads) were distinct from differentiated melanocytes (white arrowheads). mC, miniCoopR. Scale bar, 100 µM. (C) Flank of adult zebrafish expressing miniCoopR-mitfa:nlsEGFP before (left) and after (right) neocuproine treatment. Unpigmented cells with nlsEGFP-positive nuclei (yellow arrowheads) persisted whereas differentiated melanocytes (white arrowheads) died after neocuproine treatment. n = 5 fish; representative images are shown. mC, miniCoopR; BF, brightfield; neo, neocuproine. Scale bar, 100 µM. (D) Flank of adult p53(lf) zebrafish coexpressing miniCoopR-mitfa:NTR and mitfa:nlsEGFP before (left) and after (right) Mtz treatment. Unpigmented cells with nlsEGFP-positive nuclei (yellow arrowheads) were spared while differentiated melanocytes (white arrowheads) were ablated following Mtz treatment. n = 3 fish; representative images are shown. Fish were treated with epinephrine prior to imaging. mC, miniCoopR; BF, brightfield. Scale bar, 100 µM. See also Figure S2. |
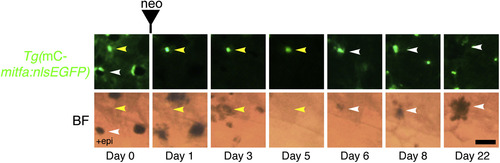
Unpigmented mitfa-Expressing Cells Give Rise to Differentiated Melanocytes by Direct Differentiation during Regeneration Lineage tracing of unpigmented mitfa-expressing cells on the flank of an adult Tg(miniCoopR-mitfa:nlsEGFP) zebrafish before and after neocuproine-mediated ablation of differentiated melanocytes. Unpigmented mitfa-expressing cells (yellow arrowheads) directly differentiated into pigmented melanocytes (white arrowheads). Differentiation was noted by the onset of melanization. Fish were treated with epinephrine only on day 0 prior to imaging. mC, miniCoopR; BF, brightfield; neo, neocuproine. Scale bar, 50 µM. See also Figure S3. |
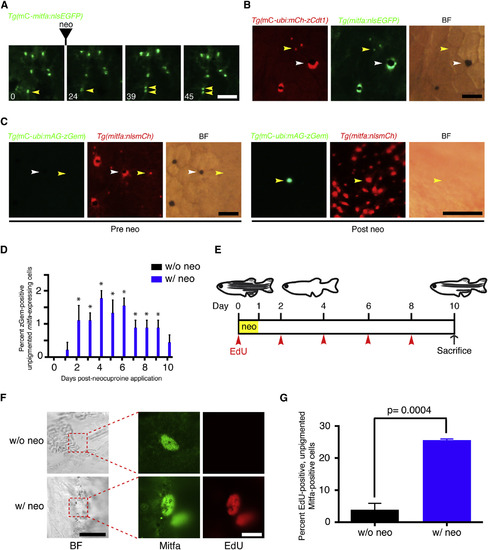
Some Unpigmented mitfa-Expressing Cells Enter the Cell Cycle upon Melanocyte Ablation (A) Flank of an adult zebrafish expressing miniCoopR-mitfa:nlsEGFP. Neocuproine treatment was performed for 24 hr, and hours after onset of treatment are indicated. An unpigmented mitfa-expressing cell undergoing mitosis is shown (yellow arrowheads). neo, neocuproine; BF, brightfield. Scale bar, 100 µM. (B) Flank of an adult zebrafish coexpressing miniCoopR-ubi:mCherry-zCdt1 and mitfa:nlsEGFP. Differentiated melanocytes (white arrowheads) and unpigmented mitfa-expressing cells (yellow arrowheads) were in the G0/G1 phase of the cell cycle. n = 100 melanocytes and n = 142 unpigmented mitfa-expressing cells from a total of three fish; representative images are shown. Fish were treated with epinephrine prior to imaging. mC, miniCoopR; mCh, mCherry; BF, brightfield. Scale bar, 100 µM. (C) Flank of an adult zebrafish coexpressing miniCoopR-ubi:mAG-zGeminin and mitfa:nlsmCherry before (left) and after (right) neocuproine treatment. Prior to neocuproine treatment differentiated melanocytes (white arrowheads) and unpigmented mitfa-expressing cells (yellow arrowheads) were not in the S/G2/M phase of the cell cycle. n = 300 melanocytes and n = 900 unpigmented mitfa-expressing cells from a total of three fish; representative images are shown. After neocuproine treatment unpigmented mitfa-expressing cells entered the S/G2/M phase of the cell cycle. The nucleus of an unpigmented AG-zGeminin-positive mitfa-expressing cell in the S/G2/M phase after neocuproine treatment is shown (yellow arrowheads). Fish were treated with epinephrine prior to imaging. mC, miniCoopR; mCh, mCherry; BF, brightfield; Gem, Geminin; neo, neocuproine. Scale bar, 100 µM. (D) Quantification of AG-zGeminin-positive unpigmented mitfa-expressing cells. n = 150 cells from each of three fish for neocuproine-treated group, n = 300 cells from each of three fish for w/o neocuproine control group. Data are shown as mean percent positive per fish ± SEM; p values calculated by Student’s t test, p < 0.05. neo, neocuproine. (E) Timeline of the experiment. Adult wild-type zebrafish were treated with neocuproine for 24 hr to ablate differentiated melanocytes and were injected with EdU every other day (arrowheads). Control animals were injected with EdU but were not treated with neocuproine. Fish were sacrificed at day 10 and were scored for EdU incorporation. neo, neocuproine. (F) Representative images of control (top row) or neocuproine-treated (bottom row) unpigmented mitfa-expressing cells after melanocyte regeneration. neo, neocuproine; BF, brightfield. BF scale bar, 25 µM; Mitfa, EdU scale bar, 10 µM. (G) Quantification of percent EdU-positive, unpigmented Mitfa-positive cells. n = 103, 83 and 38 cells from each of three fish, respectively, for neo; n = 20, 30, and 15 cells from each of three fish, respectively, for w/o neo. Data are shown as mean percent positive per fish ± SEM; p value calculated by Student’s t test. neo, neocuproine. See also Figure S4. |
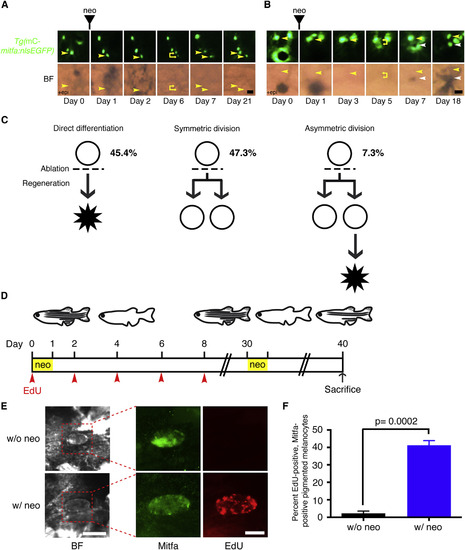
Divisions of Unpigmented mitfa-Expressing Cells during Melanocyte Regeneration (A–C) Lineage tracing of unpigmented mitfa-expressing cells on the flank of adult Tg(miniCoopR-mitfa:nlsEGFP) zebrafish after neocuproine treatment. (A) Symmetric division of an unpigmented mitfa-expressing cell (yellow arrowheads, days 0, 1, 2, 6). Neither daughter cell differentiated (yellow arrowheads, days 7, 21). Fish were treated with epinephrine only on day 0 prior to imaging. mC, miniCoopR; BF, brightfield, neo; neocuproine. Scale bar, 25 µM. (B) Asymmetric division of an unpigmented mitfa-expressing cell (yellow arrowheads, days 0, 1, 3, 5) in which one daughter differentiated (white arrowheads, days 7, 18) and the other daughter remained undifferentiated (yellow arrowheads, days 7, 18). Fish were treated with epinephrine only on day 0 prior to imaging. mC, miniCoopR; BF, brightfield, neo; neocuproine. Scale bar, 25 µM. (C) Schematic summarizing lineages of unpigmented mitfa-expressing cells that differentiated or divided following neocuproine-mediated ablation (dashed line). Percentages of each lineage are indicated. (D) Timeline of the experiment. Adult wild-type zebrafish were treated with neocuproine for 24 hr to ablate differentiated melanocytes and were injected with EdU every other day until day 8 (arrowheads). After melanocyte regeneration fish were treated with neocuproine again at day 30 for 24 hr. Control animals were injected with EdU but were not treated with neocuproine. Fish were sacrificed at day 40 and were scored for EdU incorporation. neo, neocuproine. (E) Representative images of control (top row) or neocuproine-treated (bottom row) Mitfa-positive melanocytes after melanocyte regeneration. neo, neocuproine; BF, brightfield. BF scale bar, 15 µM; Mitfa, EdU scale bar, 10 µM. (F) Quantification of percent EdU-positive, Mitfa-positive melanocytes. n = 97, 256 and 365 cells from each of three fish, respectively, for neo; n = 43, 53, and 85 cells from each of three fish, respectively, for w/o neo. Data are shown as mean percent positive per fish ± SEM; p value calculated by Student’s t test. neo, neocuproine. See also Table S1. |
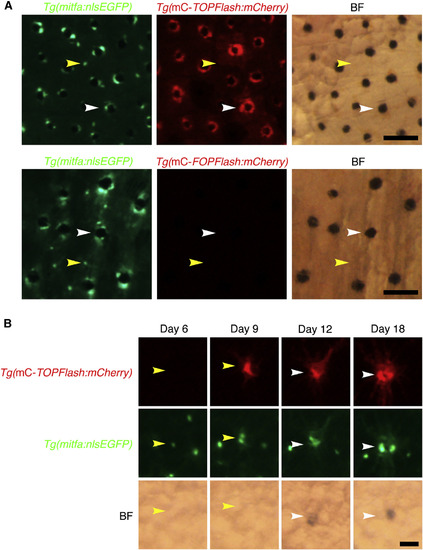
Wnt Signaling Is Activated during Melanocyte Regeneration (A) Flank of an adult zebrafish coexpressing mitfa:nlsEGFP and miniCoopR-TOPFlash:mCherry (top) or mitfa:nlsEGFP and miniCoopR-FOPFlash:mCherry (bottom). In animals with Tg(miniCoopR-TOPFlash:mCherry), mCherry signal was evident in differentiated melanocytes (white arrowheads) but not in unpigmented mitfa-expressing cells (yellow arrowheads). No mCherry signal was observed in Tg(miniCoopR-FOPFlash:mCherry) animals. Fish were treated with epinephrine prior to imaging. mC, miniCoopR; BF, brightfield. Scale bars, 100 µM. (B) Lineage tracing of unpigmented mitfa-expressing cells on the flank of an adult zebrafish coexpressing mitfa:nlsEGFP and miniCoopR-TOPFlash:mCherry after neocuproine treatment. An unpigmented mitfa-expressing cell (yellow arrowheads) beginning to express mCherry shortly before differentiation (white arrowheads). mC, miniCoopR; BF, brightfield. Scale bar, 50 µM. See also Figure S5. |
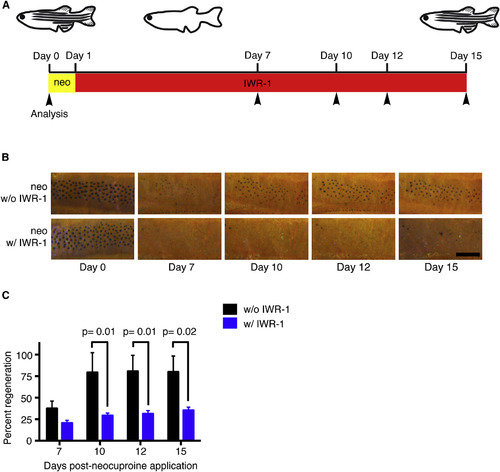
Wnt Signaling Regulates Melanocyte Regeneration (A) Timeline of the experiment. Adult wild-type zebrafish were treated with neocuproine for 24 hr to ablate differentiated melanocytes and were then treated with the Wnt inhibitor IWR-1 for 14 days. Control animals were treated with neocuproine and then DMSO alone. Fish were scored for regeneration melanocytes at 7, 10, 12, and 15 days (arrowheads) after neocuproine treatment. neo, neocuproine. (B) Representative images of control (top row) or IWR-1-treated (bottom row) animals during melanocyte regeneration. Fish were treated with epinephrine prior to imaging. neo, neocuproine. Scale bar, 500 µM. (C) Quantification of melanocyte regeneration. Data are shown as mean ± SEM; p values calculated by Student’s t test, Day 7 p = 0.36. See also Figure S6. |
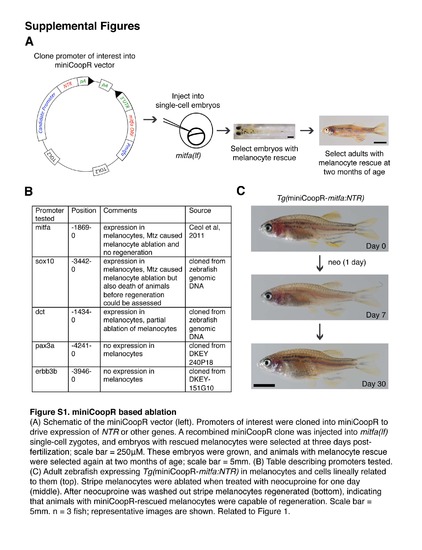
miniCoopR based ablation Schematic of the miniCoopR vector (left). Promoters of interest were cloned into miniCoopR to drive expression of NTR or other genes. A recombined miniCoopR clone was injected into mitfa(If) single-cell zygotes, and embryos with rescued melanocytes were selected at three days post-fertilization; scale bar = 250 µM. These embryos were grown, and animals with melanocyte rescue were selected again at two months of age; scale bar = 5 mm. (B) Table describing promoters tested. (C) Adult zebrafish exressing Tg(miniCoopR-mitfa:NTR) in melanocytes and cells lineally related to them (top). Strip melanocytes were ablated when treated with neocuproine for one day (middle). After neocuproine was washed out stripe melanocytes regenerated (bottom), indicating that animals with miniCoopR-rescued melanocytes were capable of regeneration. Scale bar = 5 mm. n = 3 fish; representative images are shown. Related to Figure 1. |
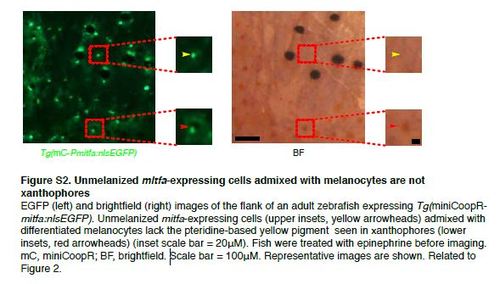
Unmelanized mitfa-expressing cells admixed with melanocytes are not xanthophores EGFP (left) and brightfield (right) images of the flank of an adult zebrafish expressing Tg(miniCoopRmitfa: nlsEGFP). Unmelanized mitfa-expressing cells (upper insets, yellow arrowheads) admixed with differentiated melanocytes lack the pteridine-based yellow pigment seen in xanthophores (lower insets, red arrowheads) (inset scale bar = 20µM). Fish were treated with epinephrine before imaging. mC, miniCoopR; BF, brightfield. Scale bar = 100µM. Representative images are shown. Related to Figure 2. |
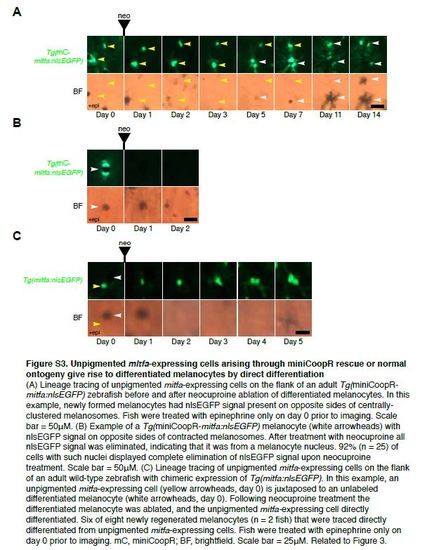
Unpigmented mitfa-expressing cells arising through miniCoopR rescue or normal ontogeny give rise to differentiated melanocytes by direct differentiation (A) Lineage tracing of unpigmented mitfa-expressing cells on the flank of an adult Tg(miniCoopRmitfa: nlsEGFP) zebrafish before and after neocuproine ablation of differentiated melanocytes. In this example, newly formed melanocytes had nlsEGFP signal present on opposite sides of centrallyclustered melanosomes. Fish were treated with epinephrine only on day 0 prior to imaging. Scale bar = 50µM. (B) Example of a Tg(miniCoopR-mitfa:nlsEGFP) melanocyte (white arrowheads) with nlsEGFP signal on opposite sides of contracted melanosomes. After treatment with neocuproine all nlsEGFP signal was eliminated, indicating that it was from a melanocyte nucleus. 92% (n = 25) of cells with such nuclei displayed complete elimination of nlsEGFP signal upon neocuproine treatment. Scale bar = 50µM. (C) Lineage tracing of unpigmented mitfa-expressing cells on the flank of an adult wild-type zebrafish with chimeric expression of Tg(mitfa:nlsEGFP). In this example, an unpigmented mitfa-expressing cell (yellow arrowheads, day 0) is juxtaposed to an unlabeled differentiated melanocyte (white arrowheads, day 0). Following neocuproine treatment the differentiated melanocyte was ablated, and the unpigmented mitfa-expressing cell directly differentiated. Six of eight newly regenerated melanocytes (n = 2 fish) that were traced directly differentiated from unpigmented mitfa-expressing cells. Fish were treated with epinephrine only on day 0 prior to imaging. mC, miniCoopR; BF, brightfield. Scale bar = 25µM. Related to Figure 3. |
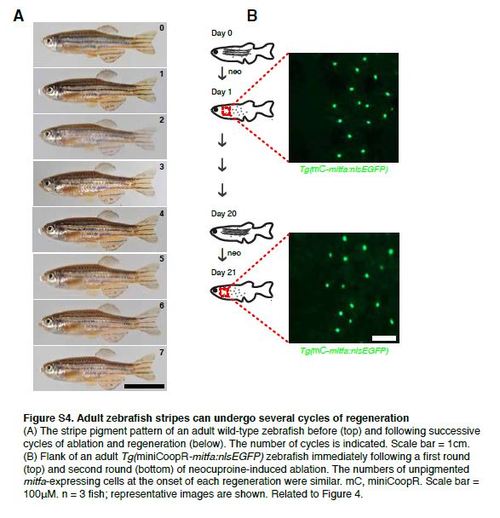
Adult zebrafish stripes can undergo several cycles of regeneration (A) The stripe pigment pattern of an adult wild-type zebrafish before (top) and following successive cycles of ablation and regeneration (below). The number of cycles is indicated. Scale bar = 1cm. (B) Flank of an adult Tg(miniCoopR-mitfa:nlsEGFP) zebrafish immediately following a first round (top) and second round (bottom) of neocuproine-induced ablation. The numbers of unpigmented mitfa-expressing cells at the onset of each regeneration were similar. mC, miniCoopR. Scale bar = 100µM. n = 3 fish; representative images are shown. Related to Figure 4. |
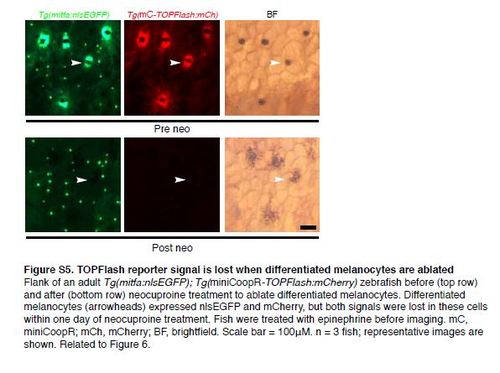
TOPFlash reporter signal is lost when differentiated melanocytes are ablated Flank of an adult Tg(mitfa:nlsEGFP); Tg(miniCoopR-TOPFlash:mCherry) zebrafish before (top row) and after (bottom row) neocuproine treatment to ablate differentiated melanocytes. Differentiated melanocytes (arrowheads) expressed nlsEGFP and mCherry, but both signals were lost in these cells within one day of neocuproine treatment. Fish were treated with epinephrine before imaging. mC, miniCoopR; mCh, mCherry; BF, brightfield. Scale bar = 100µM. n = 3 fish; representative images are shown. Related to Figure 6. |
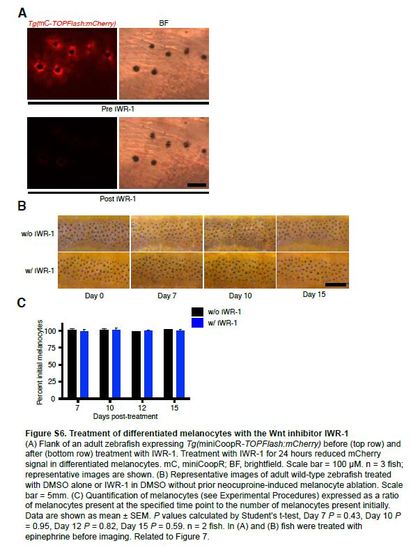
Treatment of differentiated melanocytes with the Wnt inhibitor IWR-1 (A) Flank of an adult zebrafish expressing Tg(miniCoopR-TOPFlash:mCherry) before (top row) and after (bottom row) treatment with IWR-1. Treatment with IWR-1 for 24 hours reduced mCherry signal in differentiated melanocytes. mC, miniCoopR; BF, brightfield. Scale bar = 100 µM. n = 3 fish; representative images are shown. (B) Representative images of adult wild-type zebrafish treated with DMSO alone or IWR-1 in DMSO without prior neocuproine-induced melanocyte ablation. Scale bar = 5mm. (C) Quantification of melanocytes (see Experimental Procedures) expressed as a ratio of melanocytes present at the specified time point to the number of melanocytes present initially. Data are shown as mean ± SEM. P values calculated by Student’s t-test, Day 7 P = 0.43, Day 10 P = 0.95, Day 12 P = 0.82, Day 15 P = 0.59. n = 2 fish. In (A) and (B) fish were treated with epinephrine before imaging. Related to Figure 7. |
Reprinted from Developmental Cell, 33(6), Iyengar, S., Kasheta, M., Ceol, C.J., Poised Regeneration of Zebrafish Melanocytes Involves Direct Differentiation and Concurrent Replenishment of Tissue-Resident Progenitor Cells, 631-43, Copyright (2015) with permission from Elsevier. Full text @ Dev. Cell