
- Title
-
A dynamic intracellular distribution of Vangl2 accompanies cell polarization during zebrafish gastrulation
- Authors
- Roszko, I., Sepich, D., Jessen, J.R., Chandrasekhar, A., Solnica-Krezel, L.
- Source
- Full text @ Development
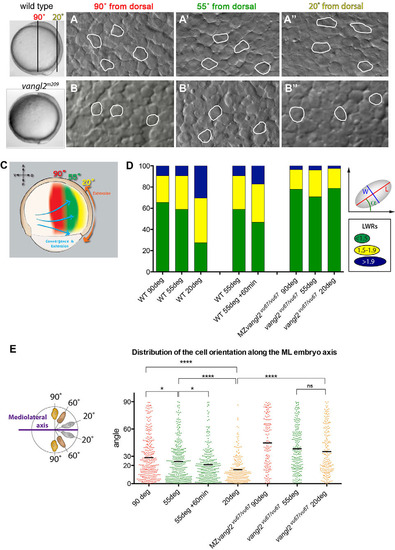
Spatiotemporal dynamics of mesodermal cells during C&E. (A-B′′) Nomarski images of mesodermal cells at 90° (A,B), 55° (A′,B′) and 20° (A′′,B′′) from dorsal in WT (A-A′′) and vangl2 mutant (vangl2m209/m209, B-B′′) embryos at yolk plug closure stage (9.5hpf). Selected cells are outlined to indicate shape. (C) Schematic representation of zebrafish embryo at 75% epiboly stage, showing the locations examined: 90° (red), 55° (green) and 20° (yellow). (D) The distribution of cell length to width ratio (LWR) at the examined locations and time points in WT, vangl2vu67/vu67 and MZvangl2vu67/vu67 embryos. The schematic explains the method used to measure the cell shape (LWR) and orientation (angle α). (E) Orientation of the major axis of each cell analyzed within the examined locations at 9hpf in WT, vangl2vu67/vu67 and MZvangl2vu67/vu67 embryos, and at 9hpf and 10hpf at the 55° location. *P<0.05, ****P<0.0001; ns, not significant; unpaired t-test with Welch′s correction; bar indicates the mean angle. |

Dynamic Vangl2 intracellular localization during gastrulation. (A-E′) Confocal images of WT embryos showing the intracellular and membrane localization of Vangl2 (A-E) and β-catenin (A′-E′). (F) Quantification of Vangl2 and β-catenin fluorescence intensity in individual cells (three independent cells shown in lines of different color) at 6hpf and 8.4hpf, obtained using the Plot Profile tool (Fiji) through the length of the cell. Peaks correspond to cell membrane. Scale bars: 20µm. |

Membrane localization of Vangl2 in embryos with patterning defects. Confocal images of whole-mount immunostaining with antibodies against zebrafish Vangl2 C-terminus (A-C) and β-catenin (A′-C′) in MZoeptz257/tz257 (A,A′) and MZichabod (B,B′) embryos, and WT embryos injected with 100pg noggin synthetic mRNA (C,C2). Scale bars: 20µm. |

Vangl2 membrane localization in PCP mutant backgrounds. Confocal images of whole-mount immunostaining with antibody against zebrafish Vangl2 C-terminus at 2s stage (10.7hpf) in embryos mosaically expressing Xdd1 and H2B-RFP (A,A′) or in knyfr6/fr6 (B), MZfz7ae3/e3;MZfz7bhu3465/hu3465 (C), MZllkrw468/rw468 (D) or MZvangl2vu67/vu67 embryos (11.7hpf, 5 s) containing transplanted WT cells (showing strong Vangl2 membrane expression) (E). Scale bars: 20µm. |

Heterochronic cell transplantations. (A) The experimental scheme. (B-E′′) Confocal images of donor and host embryos after immunostaining for Vangl2 and mCherry. (B-C′′) Results of transplantation from younger donor embryos into older hosts. (B) Donor embryo 2h post transplantation, 6hpf. (C-C′′) Host embryo 2h post transplantation, 8hpf. (D-E′′) Results of transplantation from older donor embryos into younger hosts. (D) Donor embryo 2h post transplantation, 8hpf. (E-E′′) Host embryo 2h post transplantation, 6hpf. (C,E) mCherry staining shows the transplanted cells. (F-H) Quantitative data showing the membrane fluorescence intensity (FI) in transplanted cells, and endogenous cells in host and donor embryos. Quantitative data are from homochronic (control) and heterochronic cell transplantations. Bars represent the mean FI. ****P<0.0001; ns, not significant; unpaired t-test with Welch′s correction. Scale bars: 20µm. |

Enrichment of Vangl2 at anterior membranes of mediolaterally elongated cells. (A-C′) Live embryos at 90% epiboly stage (9hpf; A,A2) or 5s stage (11.7hpf; B-C′). mCherry- and GFP-Vangl2-expressing cells were transplanted from Tg(vangl2:GFP-Vangl2) embryos into the WT unlabeled host. Yellow arrowheads indicate the anterior cell membranes where Vangl2 is enriched. (D,E) GFP-Vangl2 and mCherry posterior/anterior membrane FI ratios of individual cells in the notochord at 90% epiboly stage (9hpf) and at 5-6s stage (11.7-12hpf) (D) or in the neuroectoderm at 5-6s stage (11.7-12hpf) (E). The blue bars represent the average posterior/anterior FI ratios for each condition. (F-I) Vangl2 asymmetry analysis using GFP-VANGL2 mosaic expression. (F) Modified image of 64-cell stage embryo showing the mosaic synthetic mRNA injection performed. (G) Live embryos mosaically expressing GFP-VANGL2 (green)/H2B-RFP (red) in notochord cells. (H) Plot Profile (Fiji) quantification of FI of two cells (white rectangle in G) at four different z-planes (confocal optical slices). (I) Comparison of GFP-VANGL2, GFP-Vangl2 and corresponding mCherry membrane FI ratios of individual cells in the notochord at 5-6s (11.7-12hpf) stage. *P<0.05, **P<0.01, ***P<0.001; ns, not significant; unpaired t-test with Welch′s correction. Scale bars: 20µm in A,A′; 10µm in B-C′. |

Vangl2 membrane localization in embryos with defective PCP signaling. (A-B′) Live embryos mosaically expressing GFP-VANGL2 and mCherry. Arrows indicate individual cells showing anteriorly biased Vangl2 membrane localization. (C) Quantification of mGFP (green) and mCherry (red) posterior/anterior membrane FI ratios obtained by analyzing individual cells in the notochord of 5-6 s stage (11.7-12hpf) embryos in specified mutants or Xdd1 RNA-injected embryos. The data plot shows the quantification of either GFP-Vangl2 from Tg(vangl2:GFP-Vangl2) cells in MZvangl2vu67/vu67 and Xdd1-injected embryos, or of GFP-VANGL2 in MZfz7ae3/e3;MZfz7bhu3465/hu3465 and knyfr6/fr6 embryos. GFP-Vangl2 and GFP-VANGL2 quantification data are combined for the WT embryos. Blue bar indicates the average posterior/anterior FI ratio for each condition. **P<0.01, ****P<0.0001; ns, not significant; unpaired t-test with Welch′s correction. Scale bars: 10µm. |

Rescue of the MZvangl2vu67/vu67 phenotype with GFP-VANGL2 synthetic mRNA. (A) 30hpf WT embryo. (B) 30hpf MZvangl2vu67/vu67 embryo. (C,D,E) 30hpf MZvangl2vu67/vu67 embryos injected at 1-cell stage with 25 pg, 50 pg or 75 pg synthetic GFP-VANGL mRNA. |

Vangl2 protein expression at blastula stages. Confocal images of embryos after immunostaining using the anti-C-terminal Vangl2 antibody (green) and anti-β-catenin (red). β-catenin staining was used as control in order to visualize the cell membranes. Several embryos are shown in order to represent the variability of the anti-Vangl2 staining at the membrane versus cytoplasm between embryos at the same developmental stage. All images were acquired at the animal pole location. (A-C′) 3 different embryos at sphere stage (4hpf). (D-F′) 3 different embryos at 1K stage (3hpf). Note the weak Vangl2 staining (green) at the membrane and the abundant puncta in the cytoplasm. Scale bars, 20 µm. |
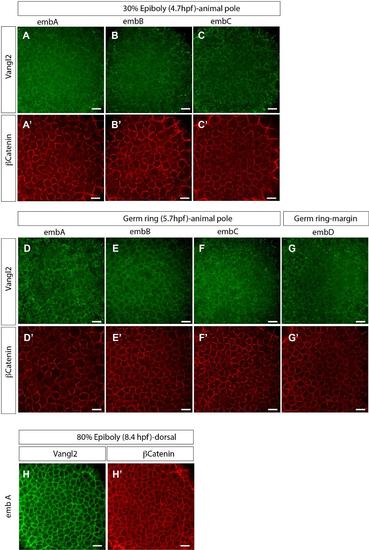
Vangl2 protein expression from 30% epiboly to 80% epiboly stages. Confocal images of embryos after immunostaining using the anti-C-terminal zVangl2 antibody (green) and anti-β-catenin (red). β-catenin staining was used as control in order to visualize the cell membranes. Several embryos are shown in order to represent the slight variability of the anti-Vangl2 staining at the membrane versus cytoplasm between embryos at the same developmental stage. (A-C′) 3 different embryos at 30% epiboly stage (4.7hpf). Images were acquired at the animal pole location. (D-F′) 3 different embryos at germ ring stage (5.7hpf) (images acquired at the animal pole location). (G-G′) embryos at germ ring stage (images acquired at the embryonic margin location). (H-H′) embryos at 80% epiboly stage (8.4hpf) (images acquired at the dorsal location). Scale bars, 20 µm. |

Vangl2 membrane localization in ventral, lateral or dorsal domain of the embryo does not show domain specific preference. (A-B′′) Confocal images acquired in the ventral (A,B), lateral (A′B′) and dorsal (A′′,B′′) domains in the embryo. Images were taken in all 3 domains of the same embryo and analyzed separately. Embryos at 80% epiboly stage (8.4hpf) were analyzed. (C) Quantitative data obtained from the analysis of the Vangl2 staining fluorescence intensity at the cell membrane in 5 different embryos (each embryo’s D, V, L data set is in different color on the histogram). (D) Quantitative data comparing β-catenin (control) and Vangl2 staining for 3 different embryos in all D, L V domains, showing no domain specific preference for neither protein. All data were normalized such as dorsal=1. Scale bars, 20 µm. |