
- Title
-
Variations in sister chromatid cohesion dysfunction in esco2 mutant zebrafish reflects the phenotypic diversity of Roberts Syndrome
- Authors
- Percival, S.M., Thomas, H.R., Amsterdam, A., Carroll, A.J., Lees, J.A., Yost, H.J., Parant, J.M.
- Source
- Full text @ Dis. Model. Mech.
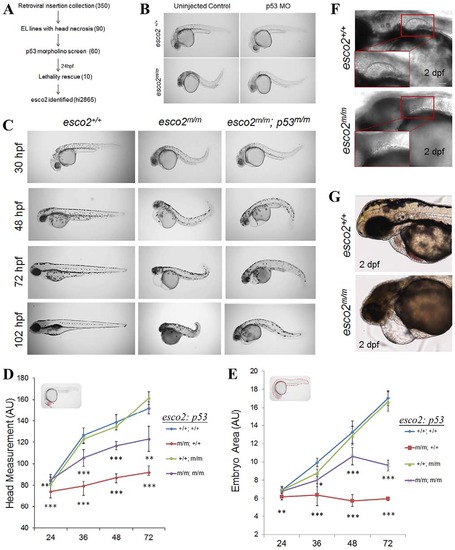
Genetic screen identifies the retroviral insertion embryonic lethal mutant, hi2865. (A) Design of the screen used to identify insertion mutants exhibiting microcephaly and head necrosis, amongst 350 embryonic lethal (EL) mutants, that are rescued by morpholino (MO) knockdown of p53 (numbers in parentheses indicate the number of mutants at each stage) at 24hpf. (B) Brightfield images of a 24-hpf hi2865 sibling and homozygous mutant (henceforth esco2hi2865/hi2865 will be referred to as esco2m/m) embryos injected or uninjected with p53 MO. (C) esco2+/+, esco2m/m and esco2m/m; p53dzy7/dzy7 (henceforth p53dzy7/dzy7 will be referred to as p53m/m) gross morphological phenotypes between 30hpf and 102hpf (4dpf). (D) Head measurements and (E) embryo area of esco2+/+, esco2m/m, esco2+/+; p53/ and esco2m/m; p53/ were measured using ImageJ in arbitrary units (n=5/genotype, mean±s.d., *P<0.05, **P<0.01, ***P<0.001; significance values shown below the red line are derived from comparing esco2m/m versus esco2+/+; significance values shown below the purple line are from comparing esco2m/m; p53m/m versus esco2m/m). Insets in each graph depict the measurement parameters highlighted in red. (F,G) DIC images depict fin and heart defects, respectively, in esco2m/m. Insets detail normal fin and remnant fin bud. Scale bars: 50µm. |

p53 activation and neural tube apoptosis is an early consequence of loss of esco2. (A) Western blot for p53 protein levels in protein extracts from AB (esco2+/+), esco2 sib (esco2+/+ and esco2+/m), esco2 mutant (esco2m/m), esco2sib; p53m/m and esco2m/m; p53m/m embryos at 18 and 30hpf. Irradiated (IR) embryos at 100Gy were used as a positive control. Relative intensities were determined using ImageJ; each sample was normalized to GAPDH intensity, and then relative expression was calculated against esco2+/+ (relative normalized intensity=1). (B) Fluorescent and DIC/fluorescent merge images of esco2+/+ and esco2m/m 24-hpf embryos stained with acridine orange. (C) Acridine orange time-course staining spatially displaying apoptotic cells in esco2+/+, esco2m/m and esco2m/m; p53m/m. AB embryos irradiated at 24hpf were used as a positive control for DNA-damage-induced neural tube apoptosis. Insets depict higher magnification to visualize neural tube apoptosis. EXPRESSION / LABELING:
PHENOTYPE:
|

esco2 deficiency results in an elevated mitotic index and scattered chromosomes. (A) Maximum intensity projections of whole-embryo confocal z-stack images of pH3-stained fixed WT and mutant embryos. The embryo proper is outlined by the white dotted line. Yolk has been removed for imaging. (B) Quantification of the number of pH3-positive cells per embryo in A (n=3/genotype, mean±s.d., **P<0.01). (C) Western blot analysis for pH3 protein levels from esco2+/+ (AB), esco2 sibling (+/+ and m/+) and esco2 mutant (m/m) embryo protein lysates. Relative intensity calculated using ImageJ; each sample was normalized to α-tubulin intensity, and then relative expression was calculated against esco2+/+ (relative normalized intensity=1). (D) Diagram of mitotic profiling. Four independent fields of a pH3-labeled embryo are imaged, compiled using maximum intensity projection, and scored for each phase of mitosis based on chromosome morphology. (E) Colored panels depict the associated pH3 morphology to its phase in mitosis. (F) Graph depicting the percentage of cells in each phase of mitosis between AB (the WT parental strain) controls, esco2+/+ and esco2m/m embryos (four fields/embryo, ne70 morphologies per embryo, three embryos/genotype, mean±s.d.); the P-value of scattered between esco2+/+ and esco2m/m is 0.0062. |

In vivo analysis of esco2 mutants reveals chromosome scattering and a prolonged division time. (A) Schematic of in-embryo confocal imaging. Embryos are injected at the one-cell stage, embedded in low-melt agarose at 24hpf in a coverslip-bottom dish, and visualized with confocal imaging focusing on the thinner tail region. (B) Stills extracted from time-lapse imaging videos of wild-type embryos emphasizing phases of mitosis beginning at prophase and ending at the formation of two daughter cells. Time stamps are in minutes. (C) Division time of AB, esco2+/+ and esco2m/m calculated from nuclear envelope breakdown (NEB) to division into two daughter cells in minutes (mean±s.d., **P<0.01 derived from comparing m/m to either AB or +/+). (D) Time-lapse imaging stills extracted from videos depict esco2 mutant′s mitotic entry, spindle rotation and scattering, and mitotic exit resulting in micronuclei formation (arrowhead). Arrows point towards the cell of interest. Curved arrows orient to the direction of spinning. Time stamps are in minutes. PHENOTYPE:
|
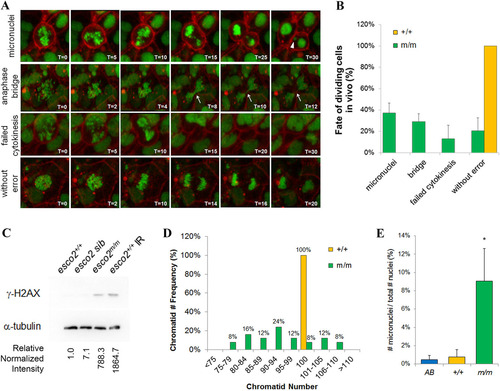
Depletion of esco2 results in genomic instability. (A) Stills taken from time-lapse imaging videos demonstrating the variety of genomic instability observed in 24-hpf esco2 mutant embryos. Micronuclei, anaphase bridges and failed cytokinesis were observed, as well as ‘without error’ divisions. Arrowhead points towards micronuclei. Arrow points to an anaphase bridge. Time stamps are in minutes. (B) Average frequency of above division fates in wild-type (11 divisions taken from three embryos) and esco2 mutant (43 divisions from four embryos) embryos based on time-lapse imaging. Error bars show mean±s.d. between embryos. All wild-type cells underwent a normal division; therefore, there is no s.d. or error bar to report. (C) Western blot of γ-H2AX in protein lysates from 24-hpf esco2+/+ (AB), esco2 sib (+/+ and +/m) and esco2m/m embryos. Irradiated (IR) embryos (100Gy at 24hpf and collected at 30hpf) serve as a positive control. Relative intensity was calculated using ImageJ; each sample was normalized to α-tubulin intensity, and then relative expression was calculated against esco2+/+ (relative normalized intensity=1). (D) Quantification of the number of chromatids within metaphase spreads (ne20 spreads per genotype) from pooled (10-12 embryos) esco2+/+ (AB controls) and esco2m/m embryos. (E) Frequency of micronuclei observed in interphase cells of the tail region of embryos injected with H2afva-eGFP; CAAX-mCherry mRNA. Percentage is based on total number of micronuclei observed over the number of nuclei observed in interphase cells (n=3 embryos/genotype, >75 cells per field, mean±s.d., *P<0.05). |

Most cells of the esco2m/m embryo display complete cohesion loss, although some cells display mild cohesion defects, mild aneuploidy and almost normal mitotic transition. (A-C) Metaphase chromosome spreads from pooled (10-12 embryos) esco2+/+ (AB) and esco2m/m embryos display three key categories: ‘paired’, ‘paired but separated’ (PBS) and ‘separated’. (A) Percentage distribution of spread categories (n≥20 spreads/genotype) from pooled esco2+/+ and esco2m/m 24-hpf embryos. Insets in chromosome spreads are higher-magnified versions of the observed categories. If mixed categories were observed in the same spreads, they were counted toward the category in which the most prevalent phenotype was observed. (B) Frequency of PBS and separated spread categories from pooled esco2m/m at 24, 48 and 72hpf (n≥20 spreads/time-point). (C) Frequency of chromatid number within a spread categorized to be either the ‘paired but separated’ (PBS) or ‘separated’ phenotype from 24-hpf pooled esco2m/m mutants. Chart also contains frequency of chromatid number from esco2+/+ as a control. (D) Division time from NEB to NER of cells from esco2+/+ embryos, or cells divisions deemed ‘without error’ from esco2m/m embryo time-lapse videos. PHENOTYPE:
|

CRISPR/Cas9 derived esco2 null allele recapitulates esco2 retroviral insertion mutant. (A) Brightfield images of 24 hpf esco2+13/+13 allele recapitulates embryonic lethality and head necrosis (n=41 with head necrosis and 137 WT morphology) of esco2m/m. (B) Allele diagram of esco2 +13 allele. A 13 bp insertion occurs in the second ATG containing exon of the 11 exon gene. ATG denotes the transcriptional start site and TAA denotes translation stop site. Blue text indicates CRISPR target site, the PAM is boxed, and red text indicates 13 bp insertion. Codons separated by spaces, note alternative codons in the +13 allele due to the frame shift. (C) Metaphase chromosome spreads from 24 hpf pooled (n=30) esco2+13/+13 embryos. Percentage distribution of each category: “paired”, “paired but separated” (PBS), and “separated”. Representative spreads and diagrams to describe category shown above percentages (n=30 spreads). PHENOTYPE:
|