
- Title
-
Id2a is required for hepatic outgrowth during liver development in zebrafish
- Authors
- Khaliq, M., Choi, T.Y., So, J., Shin, D.
- Source
- Full text @ Mech. Dev.
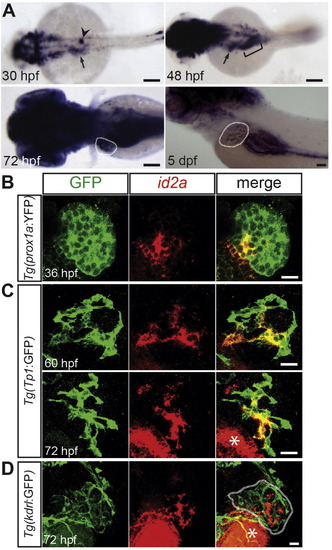
id2a expression in the developing liver. (A) WISH reveals id2a expression in the liver-forming region at 30 hpf (arrow) and in the liver at 48 hpf (arrow), 72 hpf and 5 dpf (dotted lines). From 72 hpf to, at least, 5 dpf, id2a expression in the liver appears to be restricted to BECs. Arrowhead points to the interrenal primordium; bracket denotes the intestinal bulb. Dorsal (30–72 hpf) or lateral (5 dpf) views, anterior to the left. (B–D) id2a in situ hybridization (red) combined with anti-GFP immunostaining (green) in Tg(prox1a:YFP) (B), Tg(Tp1:GFP) (C), or Tg(kdrl:GFP) (D) embryos reveals id2a expression in hepatoblasts at 36 hpf and BECs at 60 and 72 hpf, but not in the endothelial cells of the liver (dotted line), respectively. Asterisks mark id2a expression in the intestinal bulb. Single confocal section (B) or projections of z-stack confocal sections (C, D). Scale bars: 100 (A), 20 (B–D) µm. |
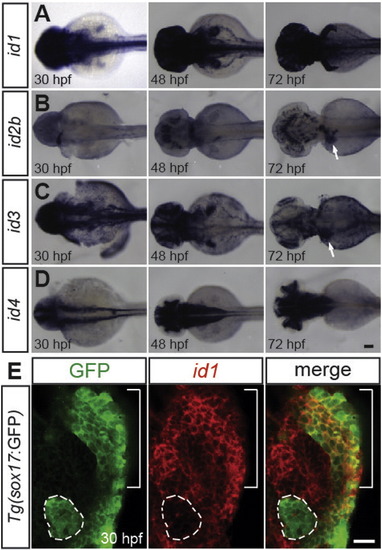
The expression patterns of id1, id2b, id3, and id4 during liver development in zebrafish. (A–D) Wild-type embryos were processed for WISH analysis with id1 (A), id2b (B), id3 (C), and id4 (D) probes. id1 appears to be ubiquitously expressed at 30 hpf, but its expression is absent in the liver at 48 and 72 hpf. id2b and id3 expression in the liver was detected at 72 hpf (arrows), but not at 30 or 48 hpf. id4 is not expressed in the liver. Dorsal views, anterior to the left. (E) id1 in situ hybridization (red), combined with anti-GFP immunostaining (green), in Tg(sox17:GFP) embryos reveals id1 expression in the liver-forming region (brackets), but not in the dorsal pancreas (dotted lines) at 30 hpf. Single confocal optical section, ventral view, anterior up. Scale bars: 100 (A–D), 20 (E) µm. EXPRESSION / LABELING:
|
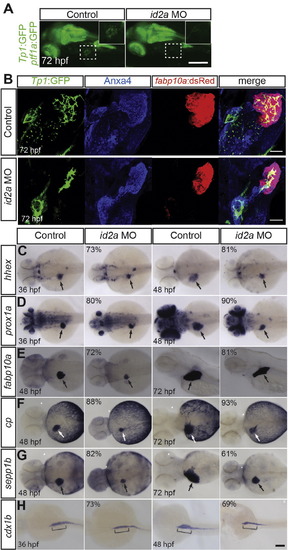
id2a knockdown reduces liver size but does not block hepatoblast specification or hepatocyte differentiation. (A) Epifluorescence images revealing a decreased number of Tp1:GFP+ BECs in the liver of id2a MO-injected embryos at 72 hpf compared with controls (squares). Higher magnification images of the square regions are shown in insets. Lateral view, anterior to the left. (B) Confocal projection images revealing fabp10a:dsRed (hepatocytes; red), Tp1:GFP (BECs; green) and Anxa4 (the hepatopancreatic ductal system; blue) expression (Zhang et al., 2014). In id2a MO-injected embryos, liver size was greatly reduced and intrahepatic BECs appeared aggregated, displaying a branching defect. (C–H) id2a MO-injected and uninjected control embryos were processed for WISH with hhex (C), prox1a (D), fabp10a (E), cp (F), sepp1b (G), and cdx1b (H) probes. Overall liver size was greatly reduced in id2a MO-injected embryos as revealed by the hepatoblast markers (hhex and prox1a) and the hepatocyte markers (fabp10a, cp, and sepp1b). However, the expression of these genes was clearly detected in the MO-injected embryos (C–G, arrows), indicating normal hepatoblast specification and hepatocyte differentiation upon id2a knockdown. The induction of the intestinal bulb as assessed by cdx1b expression appeared normal in id2a MO-injected embryos at 36 hpf; however, the intestinal bulb failed to grow at 48 hpf (H, brackets). The percentage of id2a MO-injected embryos exhibiting the representative phenotype shown is indicated in the upper left corner (n = 10–20). The remaining percentage of embryos exhibited an intermediate liver/intestinal bulb phenotype: their liver/intestinal bulb size was still smaller than that of the control embryos. Arrows point to the liver. Scale bar: 250 (A), 20 (B), and 100 (C–H) µm. EXPRESSION / LABELING:
PHENOTYPE:
|

id2a knockdown decreases hepatoblast proliferation and increases cell death in the developing liver. (A) Whole-mount immunostaining with anti-pH3 (red) anti-GFP(green) antibodies in Tg(prox1a:YFP) embryos. The total number of prox1a:YFP+ hepatic cells per liver is 316 ± 8.5 in controls and 156 ± 5.6 in id2a MO-injected embryos. (B) A graph showing the percentage of pH3+ cells among prox1a:YFP+ hepatic cells (n = 10). (C) EdU labeling (red), combined with anti-GFP immunostaining (green), in Tg(sox17:GFP) embryos reveals a significant reduction of proliferation in the liver of id2a MO-injected embryos at 40 hpf compared with controls. Dotted lines outline the liver. The total number of sox17:GFP+ cells per liver is 220 ± 16.6 in controls and 127 ± 12.7 in id2a MO-injected embryos. (D) A graph showing the percentage of EdU+ cells among GFP+ hepatoblasts (n = 10). (E) TUNEL labeling (red) combined with anti-Prox1 immunostaining (green) reveals apoptosis in the liver of id2a MO-injected embryos at 40 hpf, but not in controls. The total number of Prox1+ cells per liver is 276 ± 20.5 in controls and 140 ± 8.6 in id2a MO-injected embryos. (F) A graph showing the percentage of TUNEL+ cells among Prox1+ hepatoblasts (n = 10). *p < 0.05, **p < 0.005; error bars, ± s.e.m. Scale bars: 50 µm. |
|
id2a mRNA, but not tp53 MO, injection rescues the reduced liver size in id2a MO-injected embryos. (A, B) Epifluorescence images showing fabp10a:dsRed expression (red) in control, id2a MO-injected, and id2a MO + mRNA-co-injected embryos (A) and their quantification (B). Although the liver of the co-injected embryos was still smaller than the control liver, it was much larger than the liver of the single MO-injected embryos, indicating a partial rescue of the liver size defect exhibited in id2a MO-injected embryos. For quantification, embryos were divided into three groups based on liver size: small, medium, and large. The id2a MO-injected liver size shown in A was considered as small; the liver size of the co-injected embryo shown in A was considered as large. Dorsal view, anterior to the left. (C) Bright-field and epifluorescence images showing the overall morphology of embryos and fabp10a:dsRed expression (red), respectively, in control, tp53 MO-injected, id2a MO-injected, and id2a MO + tp53 MO-co-injected embryos. Liver size as well as eye and head size (arrows) in id2a MO-injected embryos was similar to that in embryos co-injected withid2a and tp53 MOs. (D) Quantification of the results in C. For quantification, the liver size of the control embryo shown in C was considered as large and the liver size of the id2a MO-injected embryo shown in C was considered as small. Lateral view, anterior to the left. (E) Epifluorescence images showing the fabp10a:dsRed expression (red) in control and id2a mRNA-injected embryos at 72 hpf. Liver size in id2a-mRNA injected embryos was similar to that of control embryos. Lateral view, anterior to the left. Scale bars: 100 µm. 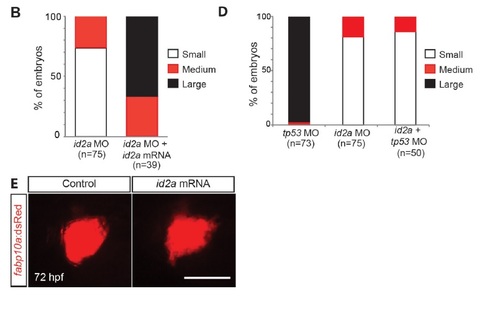

EXPRESSION / LABELING:
PHENOTYPE:
|
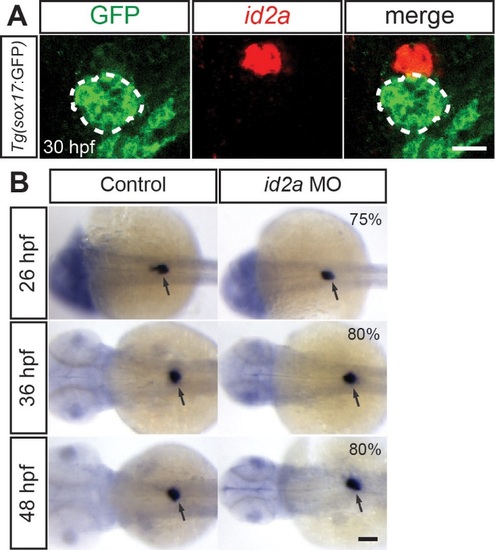
id2a knockdown does not result in a general endoderm-derived organ defect. (A) id2a in situ hybridization (red) combined with anti-GFP immunostaining (green) in Tg(sox17:GFP) embryos reveals that id2a is highly expressed in the interrenal primordium but not in the dorsal pancreas (dashed lines) at 30 hpf. Single confocal section images. (B) id2a MO-injected and control embryos were processed for WISH with the insulin probe, which marks pancreatic beta cells of the dorsal pancreas (arrows). Overall size of the dorsal pancreas appeared unaffected in the MO-injected embryos compared to controls. The percentage of id2a MO-injected embryos exhibiting the representative phenotype shown is indicated in the upper left corner (n=10-20). The remaining percentage of embryos exhibited an intermediate or slightly larger dorsal pancreas phenotype. Arrows point to the dorsal pancreas. Scale bars: 20 µm (A) and 100 µm (B). |
Reprinted from Mechanisms of Development, 138 Pt 3, Khaliq, M., Choi, T.Y., So, J., Shin, D., Id2a is required for hepatic outgrowth during liver development in zebrafish, 399-414, Copyright (2015) with permission from Elsevier. Full text @ Mech. Dev.