
- Title
-
The hormonal peptide Elabela guides angioblasts to the midline during vasculogenesis
- Authors
- Helker, C.S., Schuermann, A., Pollmann, C., Chng, S.C., Kiefer, F., Reversade, B., Herzog, W.
- Source
- Full text @ Elife
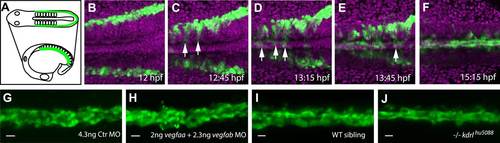
Angioblast migration to the midline is not regulated by Vegf. (A–F) Schematic (A) and confocal (B–F) in vivo time-lapse imaging of angioblasts (green) and their migration in a Tg(fli1a:EGFP)y1 embryo, injected with H2B-mCherry mRNA (purple, all nuclei), dorsal views at indicated time points. Arrows indicate the initial migration to the midline, and the coalescing into the dorsal aorta (DA). (G–J) Loss of Vegf-signaling components by vegfaa/vegfab double morpholino (MO) injection (H) or in vegf receptor 2 (kdrl) mutants (J) does not affect angioblast migration. Confocal projections of Tg(fli1a:EGFP)y1 embryos in dorsal views at 17 hpf. For each condition, n > 15. EXPRESSION / LABELING:
PHENOTYPE:
|
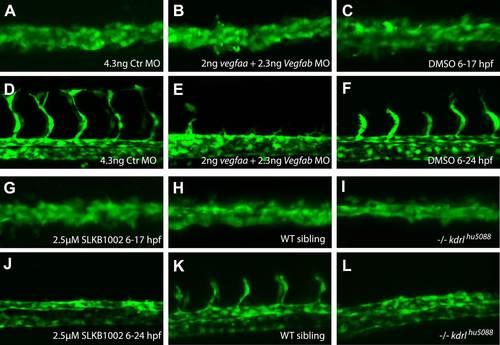
Inhibition of Vegfa signaling resulted in normal angioblast migration to the midline, but impaired sprouting angiogenesis. (A–J) Vegfa signaling was impaired using either ligand MOs (vegfaa/vegfab MO), chemical inhibition of Vegfr2 signaling (2.5 µM SLKB1002 [Zhang et al., 2011]) or mutations in the vegfr2 gene (kdrl). Confocal projections of Tg(fli1a:EGFP)y1 embryos in dorsal views at 17 hpf (A, B, C, G, H, I), 24 hpf (F, J, K, L) and 28 hpf (D, E). At 17 hpf, angioblasts in control embryos as well as Vegfa signaling deficient embryos arrived at the midline (A, B, C, G, H, I). Control embryos showed sprouting of the intersegmental vessels (D, F, K) whereas Vegfa signaling deficient embryos lacked the intersegmental vessels (E, J, I). |
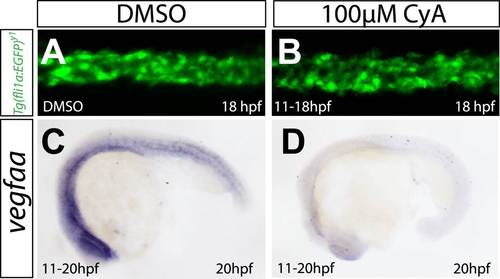
Abrogation of Shh signaling abolishes vegfaa expression, but does not influence angioblast migration. (A, B) Embryos treated with 100 µM Cyclopamine (CyA) from 11 hpf to 18 hpf to block Sonic hedgehog signaling showed no defects in medial angioblast migration. Confocal projections of Tg(fli1a:EGFP)y1 embryos in dorsal views at 18 hpf. c-d) vegfaa expression in the somites is abolished in embryos treated with 100 µM Cyclopamine (CyA) from 11 hpf to 18 hpf. |
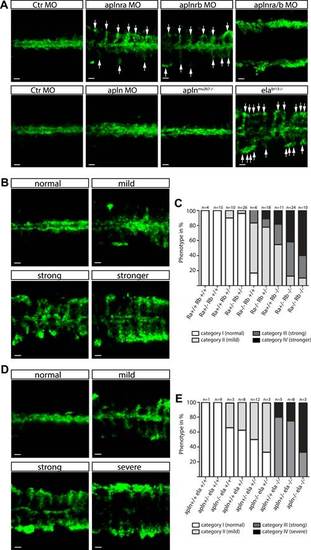
Ela/Apelin receptor - signaling guides angioblast migration to the midline. (A) Angioblasts have migrated to the midline at 17 hpf in wild type, aplnmu267 mutant or apln MO injected zebrafish embryos. MO-mediated knockdown of apelin receptor a or b partially inhibited midline migration, while simultaneous loss of both apelin receptor genes completely abolished midline migration of angioblasts. Likewise, embryos with homozygous mutations in the ligand ela display impaired migration of angioblasts. Arrows indicate aberrant positions. (B, C) Mutations in apln receptor genes impair angioblast migration. Analysis of the offspring of aplnra+/;aplnrb+/ double heterozygous parents resulted in four phenotypic categories (normal, mild, strong, stronger). (B) Genotyping of individual embryos revealed an additive effect, while mild phenotypes were observed when one receptor gene was homozygously mutant, phenotypic strength increased with additional loss of functional receptor genes (c; Ra, aplnra; Rb, aplnrb). (D, E) Ela deficiency can partially be compensated by Apln. Analysis of the offspring of apln+/;ela+/ double heterozygous parents resulted in four phenotypic categories (normal, mild, strong, severe). (D) Genotyping of individual embryos revealed a dose dependency, with increasing phenotypic strength correlating with additional loss of apln alleles in ela mutant embryos. (E) ela/; apln/ double mutants phenocopied apln receptor deficiency. Angioblasts (green) were labeled by Tg(fli1a:EGFP)y1 expression, scale bars represent 30 µm. EXPRESSION / LABELING:
PHENOTYPE:
|
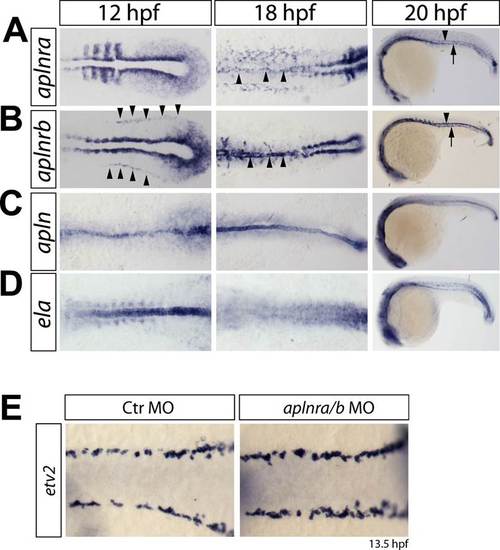
Expression of aplnra, aplnrb, apln and ela coincides with the formation of the DA and PCV. (A–D) In situ hybridizations detecting expression of aplnra (A), aplnrb (B), apln (C) and ela (D) at the indicated time points (12 hpf, 18 hpf shown in dorsal views, 20 hpf in lateral views). aplnrs are expressed in the migrating angioblasts and continue to be expressed during formation of the DA and PCV. At 12 hpf, aplnrb is strongly expressed in the angioblasts (prior to migration, arrowheads) and within the lateral plate mesoderm and at the notochord somite boundary. aplnra expression is strong in the paraxial mesoderm (A). Both receptors are expressed in the angioblasts at 18 hpf (A, B, arrowheads) and in the developing axial vessels at 20 hpf (Arrowheads point to the DA, arrows to the PCV). Prior to angioblast migration apln and ela are both expressed by the notochord, with ela showing a much stronger expression (C, D). After angioblasts reached the midline (18 hpf, 20 hpf) only apln is still expressed by the notochord, whereas notochord derived ela expression is strongly reduced to absent. (E) Knockdown of aplnr does not influence the specification of angioblasts. In situ hybridizations detecting expression of the angioblast marker etv2 at 13.5 hpf (dorsal views). EXPRESSION / LABELING:
|
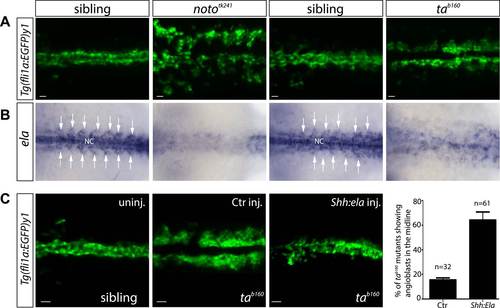
Notochord (NC) ela expression is sufficient to guide angioblasts to the midline. (A) Angioblasts fail to migrate to the midline position in the NC mutants noto and ta. Confocal projections of Tg(fli1a:EGFP)y1 embryos in dorsal view at 17 hpf (scale bars: 20 µm). (B) In situ hybridization in 17 hpf old zebrafish embryos showing ela expression from the NC and somites (white arrows). NC deficiency abolishes or strongly reduces ela expression in noto or ta mutant embryos. (C) Mosaic expression of Ela in the midline, achieved by injection of shh:ela DNA, led to rescue of angioblast migration in tab160 mutant embryos (n = 61 embryos, ctr injected n = 32 embryos). Significance was calculated by chi-square (Χ2 = 19.65) equivalent to p < 0.001 (p = 9E-06). Scale bars: 30 µm. EXPRESSION / LABELING:
PHENOTYPE:
|
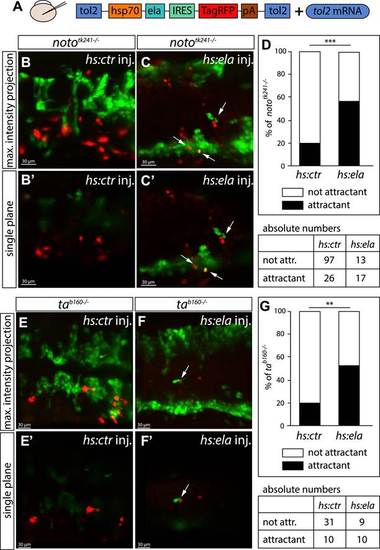
Ela overexpressing cells attract angioblasts. (A) F1 embryos from nototk241+/ or tab160+/ parents were injected with 250 pg Tol2 mRNA as well as 10 pg of DNA constructs, in which the heatshock promotor was used to drive either control (ctr, Cherry) or ela expression. Individual Ela overexpressing cells were labeled by IRES mediated RFP expression. Expression was induced by two consecutive heatshocks (incubation at 39°C) at 12 hpf and 14 hpf for 1 hr each. (B–C2) Angioblast migration in nototk241/ mutant embryos injected with the ctr (B, B2) or the ela overexpression (C, C2) construct. (D) Quantification of Ela/RFP or ctr (Cherry) positive cells showed significantly more Ela overexpressing cells attracting angioblasts than ctr cells (n = 10 embryos for hs:ela, n = 20 embryos for hs:ctr ; p*** = 0.0001). (E–F2) Angioblast migration in tab160 / mutant embryos injected with the ctr (E, E2) or the ela overexpression (F, F2) construct (G) Quantification of Ela/RFP or ctr (Cherry) positive cells showed significantly more Ela overexpressing cells attracting angioblasts than ctr cells (n = 8 embryos for hs:ela, n = 10 embryos for hs:ctr ; p** = 0.0089). Significance was calculated by chi-square test. Maximum intensity projections give an overview of the analyzed embryos. Single planes visualize the closeness of Ela or ctr (Cherry) expressing cells to angioblasts. White arrows point to Ela overexpressing cells with less than 5 µm distance to angioblasts. <5 µm distance between an Ela/ctr positive cell and an angioblast was counted as ‘attractant’; 5–40 µm distance was counted as ‘not attractant’. Scale bars represent 30 µm. |
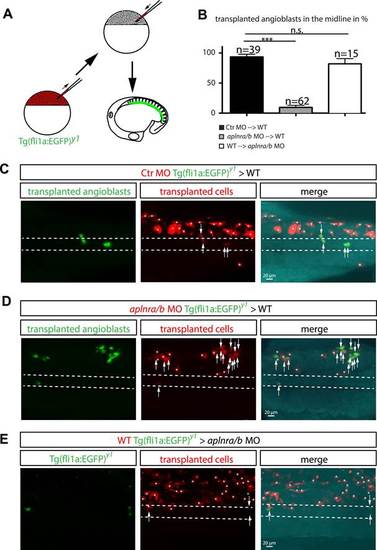
Cell autonomous requirement for Apelin receptor signaling in angioblasts. (A) Experimental design: mini-ruby injected cells from ctr MO (C) aplnra/b MO (D) or WT (E) Tg(fli1a:EGFP)y1 embryos were transplanted into WT or aplnra/b MO host embryos and scored for their migration to the midline. (B) Quantification: 93.6% of ctr MO injected (n = 39 GFP + angioblasts, 7 embryos), but only 9.4% of aplnra/b deficient (aplnra/b MO injected; n = 62 GFP+ angioblasts, 5 embryos) donor angioblasts migrated to the midline in WT host embryos. In contrast, 81.9% of WT donor angioblasts (n = 15 GFP+ angioblasts, 6 embryos) migrated to the midline in aplnra/b deficient host embryos. Error bars represent SEM, calculated using the standard deviation of percent of angioblasts in the midline per embryo. Statistical analysis showed significance using 2 way ANOVA and t-test, with p *** = 3.44577E-08 for aplnra/b MO in WT, and p = 0.232995135 (not significant, n.s.) for WT in aplnra/b MO. see also Figure 5—source data 1. (C–E) Confocal projections showing representative embryos of the transplantation experiments at 17 hpf. Arrows indicate transplanted angioblasts; asterisks label transplanted cells, which are not angioblasts; dashed lines indicate the midline. |