
- Title
-
Glypican4 promotes cardiac specification and differentiation by attenuating canonical Wnt and Bmp signaling
- Authors
- Strate, I., Tessadori, F., Bakkers, J.
- Source
- Full text @ Development
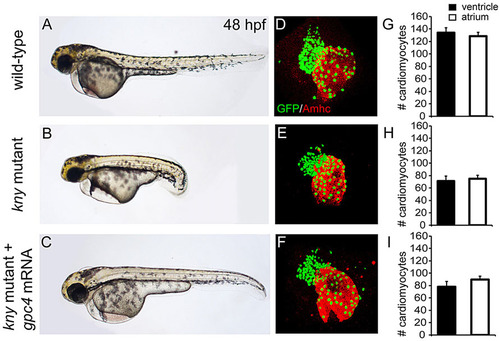
Reduced cardiomyocyte numbers in kny/gpc4 mutants. (A-C) Lateral view of wild type (WT) (A), kny/gpc4 mutant (B) and kny/gpc4 mutant injected with kny/gpc4 mRNA (C) at 48hpf. (D-F) Confocal images of hearts from Tg(myl7:galFF/UAS:h2a-gfp, kny+/) embryos stained for GFP and Amhc derived from WT (D), kny/gpc4 mutant (E) and kny/gpc4 mutant injected with kny/gpc4 mRNA (F). (G-I) Quantification of number of cardiomyocytes located in either the ventricle or atrium of WT (G), kny/gpc4 mutant (H) and kny/gpc4 mutant injected with kny/gpc4 mRNA (I) at 48hpf (n=3). Results are represented as mean±s.e.m. |
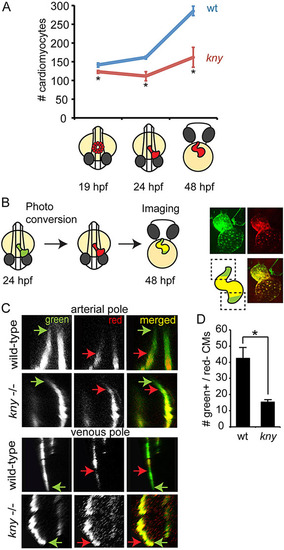
Reduced cardiomyocyte accretion in kny/gpc4 mutants. (A) Graphical representation of total cardiomyocyte counts in wild-type (wt) siblings and kny/gpc4 mutants (kny) at depicted stages. (B) Schematic of photoconversion experiment, carried out at 24hpf on Tg(myl7:nlsKikGr) or Tg(myl7:galFF;UAS:Kaede) embryos and imaged at 48hpf to visualize non-photoconverted protein (green) and photoconverted protein (red). Boxed areas indicate regions at arterial (top) and venous (bottom) poles that were imaged to analyze the accretion of cardiomyocytes (green only). (C) Optical section at the boxed areas indicated in B at the arterial or venous pole of photoconverted Tg(myl7:galFF;UAS:Kaede) wild-type siblings and kny/gpc4 mutants. Arrows in corresponding colors indicate the border of the green or the red signal, respectively. (D) Quantification of the amount of green+/red cardiomyocytes that were accreted to the arterial pole between 24 and 48hpf (n=3). Tg(myl7:nlsKikGr) was used for quantification. Results are represented as mean±s.e.m. *Pd0.05. |
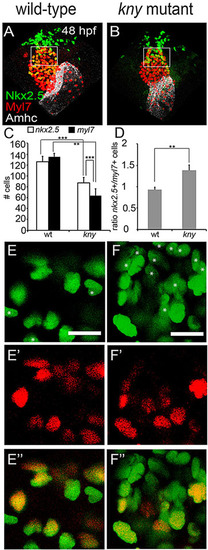
Compromised cardiomyocyte differentiation in kny/gpc4 mutants. (A,B) Embryonic hearts of wild-type and Tg(nkx2.5BAC:galFF/UAS:h2a-gfp, myl7:dsred, kny+/) embryos after immunohistochemistry against GFP (Nkx2.5, green), DsRed (Myl7, red) and Amhc (white) at 48hpf. Boxed areas indicate the regions shown in higher magnification in E3,F3 and used for quantification in C,D. (C) Numbers of nkx2.5+ and myl7+ cells in the ventricles of wild-type siblings and kny/gpc4 mutants (n=5). (D) Ratio of nkx2.5+/myl7+ cells in wild-type siblings and kny/gpc4 mutants (n=5). (E-E3) Higher magnification views of the ventricle of a wild-type sibling, showing sparse nkx2.5+-only cells (white asterisks). (F-F3) Corresponding area in a kny/gpc4 mutant, displaying a typical cluster of nkx2.5+ cells. Scale bars: 15µm. Results are represented as mean±s.e.m. **Pd0.01, ***Pd0.001 in paired t-test. |

Elevated Bmp signaling in kny/gpc4 mutants. (A) Schematic cross-section through the anterior LPM of a 20-somite stage embryo. (B-G′) Cross-sections of WT (B-D′) or kny/gpc4 mutant (E-G′) embryos with Tg(bre:gfp). Cell nuclei are shown in blue (DAPI), cardiac tissue in red (tropomyosin) and Bmp activity in green (bre:gfp transgene). B′-D′ and E′-G′ are higher magnification views of boxed areas in B-D and E-G, respectively. Arrows indicate GFP+ cardiomyocytes. Asterisks indicate lateral plate mesoderm with GFP+ cells. (H) Percentage of cardiomyocytes in kny/gpc4 mutants with higher GFP pixel intensity than the 1.5-fold average value for wild-type cardiomyocytes (n=2, 14 cells). |

Blocking Bmp signaling in kny/gpc4 mutants restores cardiomyocyte differentiation. (A) Tg(hsp70:noggin3) embryos were heat-shocked at 16hpf and analyzed at 48hpf. (B) Reconstruction of confocal images of WT, kny/gpc4 mutant and kny/gpc4 mutant with Tg(hsp70:noggin3), heat-shocked at 16hpf. Embryos were stained for myl7:dsRed (false-colored in green) and Amhc (red). (C) Quantification of cardiomyocytes in ventricle and atrium of embryos shown in B (n=3 for each group). (D) Quantifications of nkx2.5+ and myl7+ cells in the ventricles of wild-type siblings, kny/gpc4 mutants and kny/gpc4 mutants after Noggin3 induction. (E) Ratio of nkx2.5+/myl7+ ventricular cells in wild-type siblings, kny/gpc4 mutants and kny/gpc4 mutants after Noggin3 induction. Results are represented as mean±s.e.m. *Pd0.05, **Pd0.01 (paired t-test). |

Enhanced canonical Wnt signaling is responsible for reduced cardiomyocyte numbers in kny/gpc4 mutants. (A-D) In situ hybridization for axin2 at the 15-somite stage. Dorsal views (A,C) of WT (A,B) and kny/gpc4 mutant (C,D). (B,D) Cross-sections through embryos stained for axin2 (blue) and nkx2.5 (orange) of WT (B) and kny/gpc4 mutant (C). Arrows indicate ectopic axin2 signal in anterior LPM. Dashed lines in A and C indicate location of the sections shown in B and D, respectively. (E) Timeline of rescue experiments with Tg(hsp70:dkk1-gfp, myl7:galFF/UAS:h2a-gfp). HS, heat shock; 14s, 14-somite. (F) Confocal image reconstruction of wild-type or kny/gpc4 mutant embryos with or without heat shock at 48hpf, stained for GFP (green) and Amhc (red). (G) Quantification of cardiomyocytes in corresponding embryos (n=3). Results are represented as mean±s.e.m. *Pd0.05, **Pd0.01. (H) Schematic of GPI-anchored Glypican4 protein with heparin sulphate chains that can sequester growth factors, such as Wnt and Bmp, in the ECM. (I) Model summarizing the major findings of this work. |

Related to Figure 1: Reduced heart looping and reduced chamber sizes in kny/gpc4 mutants. (A-F) Anterior view of in situ hybridized wild-type (A-C) and kny/gpc4 mutant (D-F) at 58 hpf. In situ hybridization was carried out for amhc/cmlc2 (A,D), amhc alone (B,E) and vmhc (C,F). |

Related to Figure 1: Kny/gpc4 expression in wild-type embryos. (A-C) Dorsal view of wild-type embryos at 10-somite, 15-somite and 20-somite stages, respectively. (D-F) Lateral view of wild-type embryos at 24, 30 and 48 hpf, respectively. In situ hybridization was performed for kny/gpc4. |
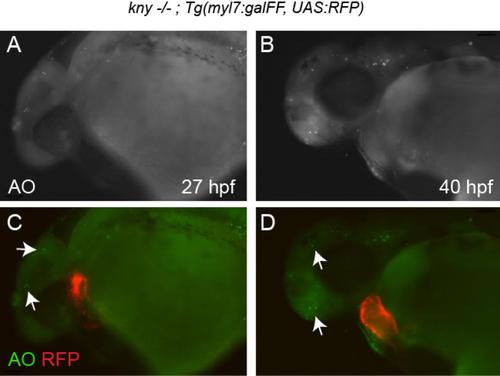
Related to Figure 1: Acridine Orange staining of kny/gpc4 mutants. Live images of kny/gpc4 mutant embryos at 27 hpf (A,C) and 40 hpf (B,D) stained with Acridine Orange (AO) to visualize apoptotic cells (green). Arrows indicate apoptotic cells in brain region. No apoptotic cells were observed in the myocardium of kny/gpc4 mutant hearts (red). |
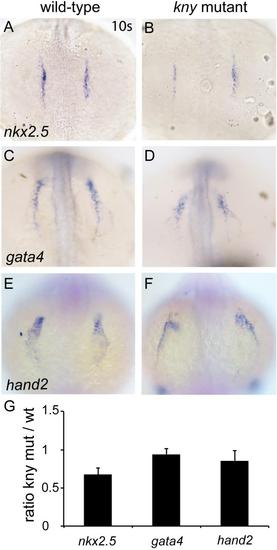
Related to Figure 2: Cardiac specification in kny/gpc4 mutants. (A-F) Dorsal view of wild-types (A,C,E) and kny/gpc4 mutants (B,D,F) at 10-somite stage. In situ hybridization was carried out for nkx2.5 (A and B), gata4 (C and D) and hand2 (E and F). (G) qPCR results of embryos from corresponding stages. Gene expression levels were normalized against ef1a. The y-axis represents the ratio of expression levels between kny/gpc4 mutants and wild-type siblings (three biological repeats). Results are represented as mean±s.e.m. |

Related to Figure 2: Specification of the SHF occurs in kny/gpc4 mutants. (A-F) Dorsal view of wild-types (A-C) and kny/gpc4 mutants (D-F) at 30 hpf. In situ hybridization was carried out for nkx2.5 (A,D), ltbp3 (blue) / myl7 (orange) (B,E) and mef2cb (blue)/myl7 (orange) (C,F). Arrows indicate staining in the SHF. |

Related to Figure 3: Nkx2.5+ cells in the anterior LPM of kny/gpc4 mutants and wild-type siblings (A,B) Dorsal view of wild-type (A) and kny/gpc4 mutant (B), expressing the nkx2.5:galFF/UAS:h2a-gfp transgene at 30 hpf. (C) Numbers of nkx2.5+ cells in boxed areas from (A,B). (D) qPCR results of nkx2.5 and myl7 expression levels at 48 hpf. Normalization against ef1a. The y-axis represents the ratio of expression level between kny/gpc4 mutants and wild-type siblings (three biological repeats). Results are represented as mean±s.e.m. |
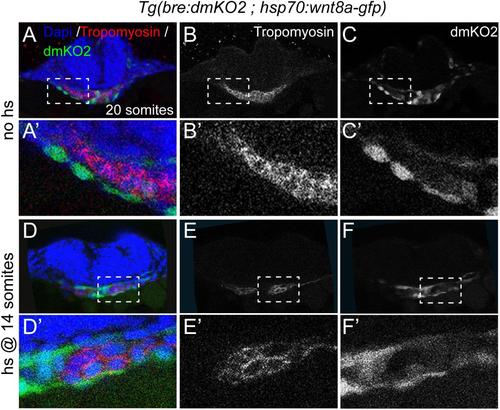
Related to Figure 4: Ectopic Wnt8 expression does not induce bre:dmKO2 activity. Cross-sections through anterior LPM of control (A-C′) or heat-shocked (D-F′) embryo of 20-somites with Tg(bre:dmKO2 ; hsp70:wnt8a-gfp). Embryos in (D-F′) were heat shocked at 16 hpf (14 somites). Cell nuclei are shown in blue (DAPI), cardiac tissue in red (tropomyosin) and Bmp activity in green (bre:dmKO2 transgene). (A′-F′) are magnifications of boxed areas in (A-F). |

Related to Figure 4: Elevation of canonical Wnt signaling after cardiac specification leads to a reduction of ventricular cardiomyocytes. (A,B) Lateral view of wild-type siblings and kny/gpc4 mutants after in situ hybridization for dkk1 at the 15 somite stage. (C,D) Hearts at 48 hpf of embryos derived from the Tg(hsp70:wnt8a-gfp) line crossed to Tg(myl7:dsred), stained for DsRed (false colored in green) and Amhc (red). (E) Cardiomyocyte numbers of corresponding hearts (n=3). (F) Quantification of nkx2.5+ and myl7+ cells in the ventricles of embryos after wnt8a induction (n=3). (G) Ratio of nkx2.5+/myl7+ cells in corresponding hearts after Wnt8 induction. Results are represented as mean ±s.e.m. Asterisks represents statistical significance according to a paired t-test: * P<0.05; ** P<0.01. |