
- Title
-
The Dlx5 and Foxg1 transcription factors, linked via miRNA-9 and -200, are required for the development of the olfactory and GnRH system
- Authors
- Garaffo, G., Conte, D., Provero, P., Tomaiuolo, D., Luo, Z., Pinciroli, P., Peano, C., D'Atri, I., Gitton, Y., Etzion, T., Gothilf, Y., Gays, D., Santoro, M.M., Merlo, G.R.
- Source
- Full text @ Mol. Cell Neurosci.
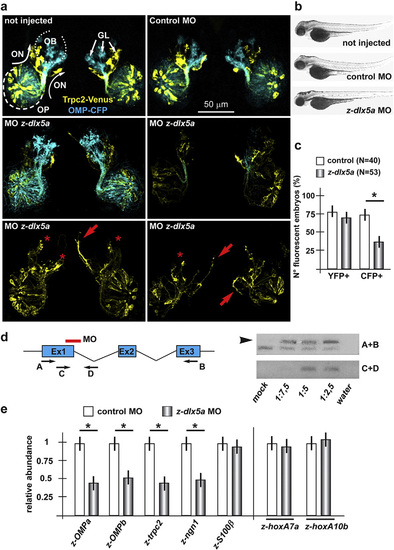
Depletion of z-dlx5a in zebrafish embryos causes delayed olfactory differentiation. a. Confocal stacked images of Trcp2::Venus (left, yellow fluorescence) and OMP::CFP (right, cyan fluorescence) zebrafish embryos not injected (left), injected with a control MO (right), or injected with anti-z-dlx5a MO (bottom panels), taken at 72 hpf. Arrows indicate the normal axonal pathway in the control embryos. Asterisks indicate the regions of reduced fluorescence intensity. b. Whole-mount bright field micrographs of injected embryo, showing an overall normal embryonic morphology and growth rate in the injected embryos, compared to the non-injected ones. c. Percentages of embryos showing YFP or CFP fluorescence, over the total of examined ones, comparing not-injected, control injected and MO injected ones. d. RT-PCR analysis on RNA extracted from anti-z-dlx5a MO-treated and control embryos, showing that the MO efficiently generates an inactive splice-variant form of the endogenous mRNA. A scheme of the z-dlx5a gene (Ex1–Ex2–Ex3), the positions of the z-dlx5a MO and the position of the PCR primers (A–D) are reported on the left. e. (on the left) Quantification of the olfactory differentiation phenotype by Real-Time qPCR for differentiation-related mRNAs in a sample of the embryonic heads of MO-injected embryos (grey bars). Embryos injected with control MO were used for comparison (open bars). Normalization is carried out relative to control samples, made = 1. (on the right) Relative abundance of z-hoxA7a and relative abundance of z-hoxA10b mRNAs in whole embryos injected with z-dlx5a MO (grey bars), to monitor developmental progression and exclude a generalized delay. |

Depletion of z-miR-9 in zebrafish embryos causes delayed olfactory differentiation. a. Micrographs of Trcp2::Venus (left, yellow fluorescence) and OMP::CFP (right, cyan fluorescence) zebrafish embryos injected with control (top panels) or anti-z-miR-9 (bottom panels) MOs. The control MO did not cause any significant alteration. Arrows indicate the normal axonal pathway in the control embryos. Asterisks indicate the regions of reduced fluorescence intensity. b. Whole-mount bright field micrographs of injected embryo, showing a normal embryonic morphology and growth rate. c. Proportion of embryos showing either YFP or CFP fluorescence, upon injection of control or z-dlx5a MO. A significant loss of CFP + embryos is detected. d. Quantification of endogenous miR-9 in zebrafish embryos injected with control or anti-z-miR-9 MOs, by Real-Time qPCR. Results show efficient depletion. e. Quantification of endogenous z-foxg1 mRNAs in zebrafish embryos injected with anti-z-miR-9 MO, by Real-Time qPCR. Results show that depletion of miR-9 causes a significant increase of the z-foxg1 mRNA. f. Quantification of developmental markers, by Real-Time pPCR, in zebrafish embryos injected with anti-miR-9 MOs, relative to control MO injected embryos. Samples were collected 72 hpf. Results are shown relative to the control injected samples, made = 1. The relative abundance of z-hoxA7a and relative abundance of z-hoxA10b mRNAs were determined, to monitor progression of development and exclude a generalized delay. |

Depletion of z-miR-200-class in zebrafish embryos causes delayed olfactory differentiation. a. Micrographs of Trcp2::Venus (left, yellow fluorescence) and OMP::CFP (right, cyan fluorescence) zebrafish embryos not injected (left), or injected with control MO, or injected with anti-z-miR-200 class (right panels) MO. The control MO did not cause significant alterations. Asterisks indicate the regions of reduced fluorescence intensity. b. Whole-mount bright field micrographs of injected embryo, showing normal embryo morphology and growth rate. c. Proportion of embryos showing either YFP or CFP fluorescence, upon injection of control or z-dlx5a MO. A significant loss of CFP + embryos is detected. d. Proportions of embryos showing either placode disorganization, olfactory axon mistargeting, or both (last bars) after injection of control or z-miR-200 class MOs. e. Quantification of endogenous miR-200 class in embryos injected with control or anti-z-miR-200 MOs, by Real-Time qPCR. Results show a significant decrease of miR-200 abundance in the injected embryos. f. Quantification of endogenous z-foxg1 mRNA in zebrafish embryos injected with anti-z-miR-9 MO, by Real-Time qPCR. Results show that depletion of miR-200 causes a significant increase of z-foxg1 mRNA abundance. g. Quantification of developmental markers, by Real-Time pPCR, in zebrafish embryos injected with anti-miR-200 class MOs, relative to control MO injected embryos, set = 1. The abundance of z-hoxA7a and abundance of z-hoxA10b were also determined and used as in Fig. 5. |

Depletion of z-miR-9 and z-miR-200-class in zebrafish embryos affects differentiation and migration of GnRH + neurons. a. Scheme showing the positions of the GnRH3::GFP + neurons (green), relative to the OPL, the OB and the olfactory nerves (yellow and blue), in a frontal view. The anterior commissure is shown at the basis of the OB. On the top is the scheme illustrating the view plane (frontal). AC, Anterior Commissure; GL, Glomeruli; OB, Olfactory Bulb; OPL, Olfactory Placode. b. Scheme illustrating the view plane (ventral) used for the fluorescent images. c–h. Micrographs of GnRH3:GFP zebrafish embryos not injected (c), injected with anti-z-miR-9 MO (d, e), or with anti-z-miR-200 class (f–h). Insets show low-magnifications merged micrographs, for reference. In not injected or control MO-injected embryos, no significant alteration was observed. White arrows indicate the normal position of the GFP + neurons. Red arrows and asterisks indicate, respectively, mispositioned GFP + neurons and loss of neurons. j. Quantification of the observed phenotypes (top, reduced number of neurons; bottom, scattered position) expressed as percent of the injected GFP + embryos showing the indicated phenotype, over the total number of GFP + embryos examined, expressed as %. k. Whole-mount bright field micrographs of control and injected embryo, showing normal embryonic morphology and growth. |

Injection of z-foxg1 mRNA in zebrafish embryos causes delayed differentiation of olfactory neurons. a. Micrographs of double-positive Trpc2::Venus; OMP::CFP zebrafish embryos injected with control irrelevant mRNA (left) or with z-foxg1 mRNA (right), taken at 72 hpf. Arrows indicate the normal axonal pathway in the control embryos, asterisks indicate the regions of reduced fluorescence intensity, dotted lines outline the placode and the main axonal bundle. b. Proportion of embryos showing either YFP or CFP fluorescence, upon injection of control (irrelevant) mRNA (open bars) or with z-foxg1 mRNA (grey bars). A significant loss of both YFP and CFP + embryos is detected. Asterisks indicate p < 0.005. c. Whole-mount bright field micrographs of injected embryo, showing slightly altered embryonic morphology and nearly normal growth rate. d. (left) Quantification of endogenous z-OMPa, z-Trcp2, z-ngn1 and z-S100β mRNAs in embryos injected with z-foxg1 mRNA, by qPCR. Values are normalized against the control injection, set = 1. The over-expression of foxg1 causes a significant decrease of these mRNAs, with the exception of z-S100β. (right) Quantifications of z-hoxA7a and z-hoxA10b mRNAs in WT embryos injected with anti-z-foxg1 mRNA, relative to control injected embryos, used as in Fig. 5. Quantification of z-foxg1 mRNA was used to verify the injection. |

a. Scheme illustrating the general position of the olfactory system with respect to the eyes, in the head of zebrafish embryos, in frontal view. GL, glomeruli; ON, Olfactory Nerves; OB, Olfactory Bulbs; OP, Olfactory Placode. b,c. Images of the organization and trajectory of the Trpc2::Venus (yellow fluorescence) and OMP::CFP (blue fluorescence) axons in the developing zebrafish embryo. The olfactory bulbs, olfactory nerves and flomeruli are indicated. |

High magnification of olfactory-associated GFP+ neurons upon injection of anti-miR-9 and anti-miR-200-class MO in GnRH3:GFP zygotes. a. The view plane relative to the images below. b. Quantification of GnRH3::GFP+ neurons in untreated and MO-injected embryos. Asterisks:p<0.01. c-e. Representative micrographs of GFP+ cells in control (c), miR-9 MO injected (d) or miR-200 MO injected (e) embyros. Images on the left are low-magnification or the same on the right. Arrows indicate mispositioned cells; asterisks indicate reduced number or absent cells. |
Reprinted from Molecular and cellular neurosciences, 68, Garaffo, G., Conte, D., Provero, P., Tomaiuolo, D., Luo, Z., Pinciroli, P., Peano, C., D'Atri, I., Gitton, Y., Etzion, T., Gothilf, Y., Gays, D., Santoro, M.M., Merlo, G.R., The Dlx5 and Foxg1 transcription factors, linked via miRNA-9 and -200, are required for the development of the olfactory and GnRH system, 103-19, Copyright (2015) with permission from Elsevier. Full text @ Mol. Cell Neurosci.