
- Title
-
Transducin Duplicates in the Zebrafish Retina and Pineal Complex: Differential Specialisation after the Teleost Tetraploidisation
- Authors
- Lagman, D., Callado-Pérez, A., Franzén, I.E., Larhammar, D., Abalo, X.M.
- Source
- Full text @ PLoS One

Adult zebrafish outer retina; structure and probe specificity. The schematic diagram of the outer retina to the left is based on Raymond and Barthel, 2004 [36] and a Nomarski contrast photomicrograph from a radial section of an adult AB zebrafish retina (A). All photoreceptors have a terminal in the outer plexiform layer (OPL). The outer nuclear layer (ONL) is subdivided by the outer limiting membrane (olm) into a sublayer where the rods have their nuclei (black asterisk: rONL) and a more external sublayer where the cones have their nuclei (empty asterisks: cONL). Note that the short single cones (SSC) have their nuclei in the rONL while their oil droplets (black arrows) and outer segments (OS) are in the cONL. The rods’ myoids (empty arrows) are embedded in the cONL. The long cone inner segment sublayer (lCIS) includes the oil droplets and myoids of the double cones (DC) and the long single cones (LSC) and part of the LSC OS. The outermost part of the retina (top) is covered by the pigmentary epithelium where the DC OS (dCOS) and the rods’ ellipsoid (arrowhead) and outer segments (ROS) are embedded. B and C are confocal photomicrographs of in situ hybridisation experiments performed using Tg(gnat2:EGFP) zebrafish, which expresses EGFP in all cones. Specific Fast Red staining in rods for gnb1a (B) and cones for gnat2 (C) can be observed. Arrows in B point to the rod´s myoids that in some cases could be mistaken as SSC. In C, the arrowhead points to a DC, the asterisk to a LSC and the star to a SSC. Scale bar in A represents 25 µm. EXPRESSION / LABELING:
|
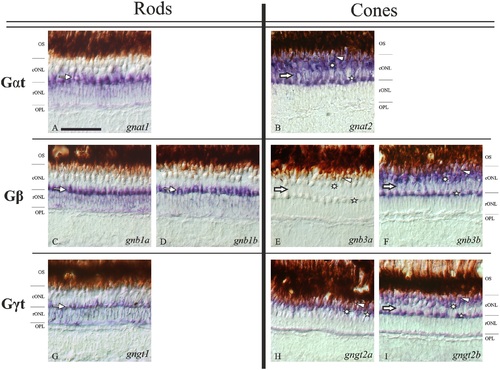
Expression patterns of each transducin subunit gene in the adult zebrafish retina. Nomarski contrast photomicrographs from radial sections of adult zebrafish retina showing the expression of all the transducin mRNAs. Panels A, C, D and G show the rod-specific expression of gnat1, gnb1a, gnb1b and gngt1, respectively. Their expression is observed in the rod nuclei of the rONL, but the strongest staining is observed in their myoids, which are embedded in the cONL sublayer (thin arrows). Panels B, F, H and I show the expression of gnat2, gnb3b, gngt2a and gngt2b, respectively, in all cones: DC (arrowheads), LSC (asterisks) and SSC (stars). The brown retinal pigment epithelium is shown the uppermost part for each picture. The stratification of the outer retina is evident in all panels except H, due to the exclusive ventral expression of gngt2a, where the stratification becomes unclear. Panel E shows the lack of staining in the adult retina for the gnb3a gene. Note that the weaker stained band into the ONLc for the cone-specific transducin subunits (thick arrows) corresponds to the rods’ myoid position (thin arrows in rods photomicrographs). Scale bar in panel A: 50 µm. For abbreviations see Fig. 2 legend. EXPRESSION / LABELING:
|

Co-expression of gnb1a and gnb1b genes in the adult zebrafish retina. Photomicrographs from an adult retina showing combination of gnb1a and gnb1b antisense riboprobes in a double ISH experiment. The upper row displays radial sections of the entire adult retina (dorsal side to the left), while the middle row shows higher magnification of the area marked within the square in the upper pictures (outermost side at the top). A and C are fluorescent pictures showing Fast Red staining for gnb1a. D is a bright-field picture showing mainly NBT/BCIP staining for gnb1b in purple but also a minimal red from the Fast Red. B and E pictures combine bright-field and fluorescence to show the co-expression of both mRNAs in the same rods. Empty arrows in panels C-E point at single rods and arrows mark the oil droplets region that gives autofluorescence in panel C. Scale bars are 200 µm for panels A-B and 50 µm for panels C-E. The bottom of the figure displays a graph showing the expression levels of the two genes at different Zeitgeber time points during the day (0 to 20 in X-axis) in relation to β-actin as housekeeping gene (Y-axis), using the 2-ΔCt method (F). Note that the expression level of gnb1a is significantly higher than gnb1b at all time points. Moreover, gnb1a expression oscillates, with significantly higher peaks of expression (p<0,05) at ZT8 and ZT16, while gnb1b does not oscillate. EXPRESSION / LABELING:
|

Expression of the gnb3 paralogs retained in zebrafish after 3R. The upper part of the figure shows two photomicrographs from radial sections of adult zebrafish eyes. The inner side is to the right and the dorsal side to the top. No mRNA could be detected for the gnb3a gene (A). Expression of the gnb3b gene (in purple) was observed in the dorsal and medial retina (B), while the ventral retina lacks mRNA (asterisk). The black-brown tissue surrounding the retina corresponds to the pigmentary epithelium. ON; optic nerve. Scale bars: 200 µm. At the bottom of the figure there is a graph comparing the cone-specific gnat2, gnb3a and gnb3b expression levels between 1 dpf, 2 dpf, 3 dpf zebrafish and eyes of 1 year old individuals in relation to the β-actin housekeeping gene using the 2-ΔCt method (C). Note the increment in the expression of gnat2 and gnb3b in the adult stage while the similar amount of mRNA for the gnb3a gene present in the 3 dpf embryos and an adult eye. EXPRESSION / LABELING:
|
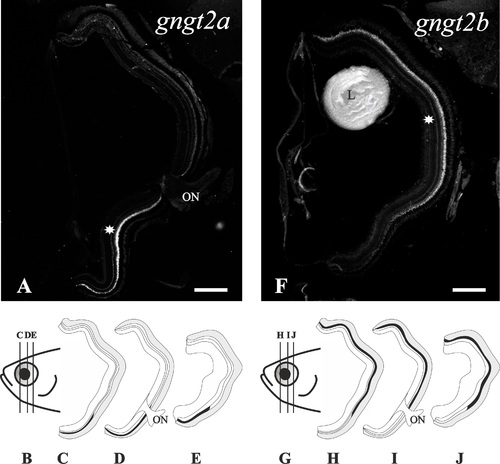
Compartmentalisation of the gngt2a and gngt2b cone-specific paralogs in the adult retina. The upper part shows two photomicrographs from radial sections of adult zebrafish eyes. The inner side is to the right and the dorsal side to the top. In them, expression patterns (asterisks) can be observed in the ventral retina for the gngt2a gene (A) and in the dorsal and medial retina for the gngt2b gene (F). At the bottom are two drawings of a zebrafish adult head in a lateral view (B, G), pointing out the level where the sections were taken for the schematic drawings in panels C, D and E for gngt2a, and panels H, I and J for gngt2b. L; lens, ON; optic nerve. Scale bars: 200 µm. EXPRESSION / LABELING:
|
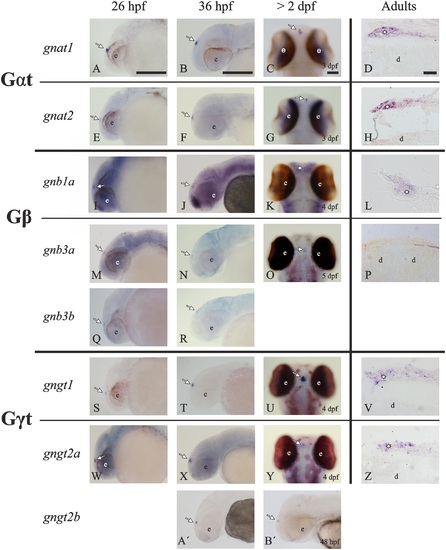
Summary of the transducin subunit gene ontogeny in the zebrafish pineal complex. The photomicrographs show the presence of mRNAs for the transducin genes in the pineal complex of zebrafish. In adults, transversal sections from the dorsal diencephalon show expression of gnat1 (D), gnat2 (H), gnb1a (L), gngt1 (V) and gngt2a (Z) in the pineal complex (asterisks) but not in the dorsal diencephalon (d). Observe the complete lack of mRNA for the gnb3a gene (P). The ontogenetic analysis shows a synchronised onset and development of expression starting at around 26 hpf for gnat1 (A-C), gnat2 (E-G), gnb1a (I-K), gnb3a (M-O), gngt1 (S-U) and gngt2a (W-Y). In addition, there is a transient expression of gnb3b (Q, R) and gnbt2b (A′, B′) in the pineal complex prior to hatching. Note the background-like expression found in the early stages for gnb1a (I-K), gnb3a (M, N) and gngt2a (W-Y). In all cases, arrows point to the location of the pineal complex, and “e” mark the location of the eyes. The photomicrographs in panels C, G, K, O, U and Y show a dorsal view of the larvae, while the others show lateral views. Scale bars: 50 µm in larvae and 30 µm in adults. For abbreviations see Fig. 2 legend. |

Summary of transducin gene ontogeny in the zebrafish retina. Photomicrographs of zebrafish larvae from 48 hpf to 5 dpf showing the onset and development of the expression for each transducin gene in the retina. All the pictures are lateral views with the rostral part to the left, except for panel J which shows a ventral view. Some eyes were dissected from the larvae for better visualisation of the staining (B, D, K, L and N). Expression is first observed in the ventral retina (arrowheads) for all genes, in accordance to cell differentiation: gnat1 (A), gnat2 (C), gnb1a (E), gnb1b (G), gnb3a (I), gnb3b (K), gngt1 (M), gngt2a (O) and gngt2b (Q). For each gene, a later stage reveals the increase in the number of positive cells: panels B, D, F, H, J, L, N, P and R, respectively. Note the similar ontogenetic pattern for gnb1a (E, F) and gnb1b (G, H), although with weaker staining for the second, and the background-like staining along the head. In addition, note that the compartmentalisations in adults are already observable at 5 dpf: exclusively ventral expression of gngt2a (asterisk in P) as well as absence of ventral expression for the gnb3b (star in L) and gngt2b (star in R). The gnb3a expression can be observed in the whole retina; however, panel J only shows the expression at 3 dpf in the ventro-medial retina (asterisks). Scale bars: 50 µm. For abbreviations see Fig. 2 legend. |
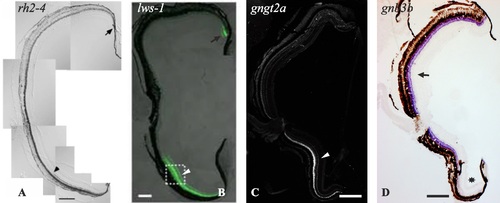
Photomontage that highlights gene specialisations of the zebrafish ventral retina. These photomicrographs show radial sections of adult zebrafish retinae. They demonstrate specific expression of rh2–4 (A), lws-1 (B) and gngt2a (C) in the ventral retina (arrowheads), while gnb3b (D) shows expression in the dorsal and medial retina (black arrow). Note that gnb3b expression is absent in the ventral retina (asterisk). The pictures in panels A and B are used with permission from Takechi and Kawamura (2005) [51] and Tsujimura et al. (2010) [50], respectively. The pictures in panels C and D are extracted from the present results. Scale bars: 200 µm. |

Unillustrated author statements |