
- Title
-
Chitin Is Endogenously Produced in Vertebrates
- Authors
- Tang, W.J., Fernandez, J.G., Sohn, J.J., Amemiya, C.T.
- Source
- Full text @ Curr. Biol.

Detection of Chitin in Zebrafish and Axolotl (A–D) In situ hybridization for chs1. NBT/BCIP signals were observed primarily in the developing digestive tract in 5 dpf (A) and 10 dpf (B) larvae, indicating that chs1 is expressed during larval development and in the gut. A representative “sense” control larva is shown in (C). No NBT/BCIP signals were observed in the developing gut of control larvae at either 5 or 10 dpf, although background staining was observed in the cranial region. Scale bars represent 500 µm. (D) The ventral region of the mid-intestine of a 10 dpf larva (transverse section, different specimen than B) shows chs1 expression in select cells within the columnar intestinal epithelium (arrowheads) and in mesenchymal cells adjacent to the intestinal epithelium (arrow). NBT/BCIP deposition was imaged in the infrared range with confocal microscopy (blue), and nuclei were stained with Sytox Green (green). Scale bar represents 10 µm. (E–M) A chitin probe (CBD-546, shown in red) was used for affinity histochemistry on fixed whole-mount specimens of zebrafish larvae (E–G) and scales (H and I) and axolotl larval forelimbs and tails (J–M). Nuclei were stained with TOTO-3 (blue), and rostral is to the left in (E) and (F). (E) 3D-rendered projection of a 4 dpf zebrafish larva. “f” and “m” represent preanal finfold and somitic muscle, respectively; the “m” designation is above the approximate junction of the middle intestine. Chitin is observed in the developing larval gut, appearing fibrillar in the lumen of the intestinal bulb and coalescing as the lumen narrows posteriorly. Scale bar represents 100 µm. (F) 3D-rendered projection of the mid-intestinal lumen from a 5 dpf zebrafish larva. The fibrous nature of the chitin is obvious, and several cells within the intestinal epithelial wall are observed that show strong chitin signals (arrowheads). A population of mesenchymal cells was also found to be positive for chitin signals (arrow). Scale bar represents 20 µm. (G) Transverse section from a 3D volume-rendered reconstruction of the image in (F) showing chitin distributed throughout the lumen of the mid-intestine. (H) Confocal image of a field of zebrafish scale epithelium. Panels show the following: CBD-546 (top left), DIC (top right), Sytox Green nuclear counterstain (pseudocolored in blue, bottom left), and merged image (bottom right). The four circular structures with red chitin signals are goblet cells that show polarized, crescent-shaped nuclei; polygonal concentric structures on the DIC overlay are squamous epithelial cells. Aggregations of small red punctate spots probably represent extracellular chitin. Scale bar represents 10 µm. (I) Maximum intensity projection of a field of scale epithelial cells in which chitin is prominent throughout the cytoplasm of club cells. Panels show the following: CBD-546 (top left), phalloidin-FITC (top right), TOTO-3 nuclear counterstain (bottom left), and merged image (bottom right). The scale specimen was simultaneously stained for F-actin using phalloidin-FITC to help distinguish individual cells. Scale bar represents 10 µm. (J) A forelimb (palm side up) of a larval axolotl after chitin histochemistry, imaged on a stereoscope. The tips of the developing digits and the palm area that show extensive chitin signals are primarily superficial epithelial cells. Scale bar represents 200 µm. (K) A field from the base of a digit from a different forelimb than shown in (J), imaged by confocal microscopy. Arrowheads indicate several specialized Leydig epidermal cells, and the arrows identify a few of the superficial epithelial cells seen in (J). Scale bar represents 50 µm. (L and M) Caudal fin of larval axolotl. (L) Maximum intensity projection showing a subset of surface epithelial cells that exhibit strong chitin signals. Scale bar represents 50 µm. (M) A deeper optical section showing strong chitin signals in the fibroblast-like cells of the fin mesenchyme. Scale bar represents 50 µm. See also Figures S1 and S2. |
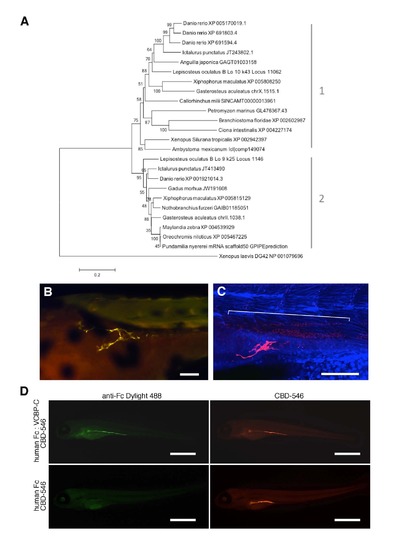
Evolutionary relationships of vertebrate chitin synthases, chitin in 3 dpf zebrafish larvae, and validation of the CBD probe specificity. (A) Amino acid sequences used in this analysis are described in Table S1 and were aligned with Clustal Omega; alignments were manually adjusted to eliminate gaps. The tree was rooted using a hyaluronan synthase gene (DG42) from Xenopus laevis. The evolutionary history was inferred using the Neighbor-Joining method of MEGA5 [S1]. The optimal tree with the sum of branch length = 4.49862894 is shown. The percentage of replicate trees in which the associated taxa clustered together in the bootstrap test (1000 replicates) is shown next to the branches. The tree is drawn to scale, with branch lengths in the same units as those of the evolutionary distances used to infer the phylogenetic tree. The evolutionary distances were computed using the Poisson correction method and are in the units of the number of amino acid substitutions per site. The analysis involved 25 amino acid sequences. All positions with less than 95% site coverage were eliminated. That is, fewer than 5% alignment gaps, missing data, and ambiguous bases were allowed at any position. There were a total of 440 positions in the final dataset. Two general CHS clades resulted from this (and other) analyses (though Clade 1 was not supported with a high bootstrap value). The tree shown should not be taken as a rigorous phylogenetic analysis since the sequence data and taxon sampling were incomplete. Rather, it shows the relationship of chitin synthase sequences among vertebrates; a more in-depth phylogenetic analysis of metazoan chitin synthases can be found in [S2]. (B, C) Chitin affinity histochemistry in 3 dpf zebrafish larva (rostral is left) shows chitin in the developing anterior gut forming discrete fiber-like structures. The specimen in (B) was imaged on an epifluorescent microscope. CBD-546 is shown in yellow, and all other fluorescent signals are from background fluorescence. A different specimen probed with CBD-546 (red), counterstained with TOTO-3 (blue), and imaged by confocal microscopy is shown in (C). In addition to the chitin fibers in the developing anterior gut, the chitin probe also bound to a presumptive endodermal cell population (indicated by the bracket). Scale bars = 100 µm. (D) Validation of the chitin specificity of our CBD probe by codetection with a completely different chitin binding domain reagent. A probe consisting of the chitin-binding fragment of the variable chitin-binding protein-C from Ciona intestinalis [S3] was linked to a human Fc region (human Fc:VCBP-C) and used together with our Bacillus circulans chitinase-derived CBD-546 probe in a single histochemical reaction on 5 dpf zebrafish larvae. A Dylight 488-labeled goat anti-human Fc antibody was used to detect the Fc portion of the probe. A single specimen treated with both the VCBP-C probe and the CBD-546 probe is shown in the top row. The binding pattern of the human Fc:VCBP-C probe was very similar to that of the CBD-546 probe. As a control, another probe containing only the human Fc fragment (no VCBPC) was used together with our CBD-546 probe in a histochemical reaction (bottom row). Detection with the same Dylight 488-labeled antibody revealed no signals from the human Fc fragment alone (the only signals are from autofluorescence), however, chitin was present as confirmed by the CBD-546 signals. Scale bars = 500 µm. |
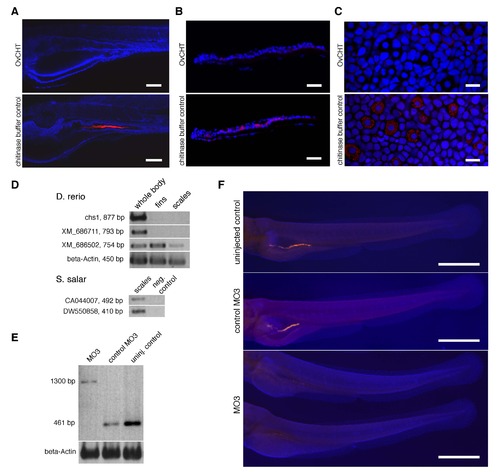
Chitinase treatment of zebrafish and axolotl specimens, and morpholino knockdown of chs1 in zebrafish larvae. (A, B, C) Chitinase treatment of zebrafish and axolotl larval specimens reduces detection by the CBD probe. (A) 5 dpf larvae were treated with chitinase from Onchocerca volvulus (OvCHT) or with just chitinase buffer, then histochemically detected with CBD-546 (red) and imaged by confocal microscopy. Chitinase-treated larvae showed strongly reduced CBD-546 signals in the intestinal lumen when compared to larvae treated with buffer control. Nuclei were counterstained with TOTO-3 (blue), and rostral is to the left. Scale bars = 100 µm. (B) Similar results were obtained in chitinase experiments carried out in parallel on cryosections of zebrafish scales. CBD-546 signals are visible in the club cells and goblet cells in the control zebrafish scale. Cryosections were counterstained with DAPI and imaged by epifluorescence microscopy. Scale bars = 50 µm. (C) Axolotl young adult caudal fin tissue also showed reduced signals from the CBD-546 probe after chitinase treatment. The control caudal fin tissue, which was dissected from the same axolotl specimen, shows CBD-546 signals in the specialized Leydig epidermal cells. Samples were counterstained with TOTO-3 and imaged by confocal microscopy. Scale bars = 30 µm. (D) RT-PCR results from three adult zebrafish RNA sources (whole body, fins, scales) for three of the four chitin synthase genes (top). Representative RT-PCR results from RNA isolated from Atlantic salmon scales (fingerlings, ~15 cm, 20-30 g) for two ESTs are shown below. These two ESTs were retrieved from the Salmo salar EST database (NCBI) with TBLASTX, using chs1 as the query. (E, F) Knockdown of chs1 using splice-blocking morpholinos. (E) RT-PCR confirmation of splice inhibition by MO3. Similar results were obtained for MO4 and its corresponding control morpholino (not shown). (F) Stereomicroscope images of zebrafish larvae after knockdown of chitin synthase gene chs1 using a splice-blocking morpholino (MO3). Morpholinos (MO3, MO4, or the respective mismatch control morpholinos) were injected into zebrafish embryos at the 1-cell stage, and the resulting larvae were collected at 4 dpf and assayed for chitin. A wildtype, uninjected larva is shown at the top for comparison. Larvae were counterstained with DAPI (blue) for better discrimination of the chitin signals (orange-red). MO3 morphants displayed greatly reduced chitin signals in the gut as compared to controls; the MO4 morphants were similarly affected (not shown). Scale bars = 500 µm. |