
- Title
-
Fate mapping of ptf1a-expressing cells during pancreatic organogenesis and regeneration in zebrafish
- Authors
- Wang, Y.J., Park, J.T., Parsons, M.J., Leach, S.D.
- Source
- Full text @ Dev. Dyn.
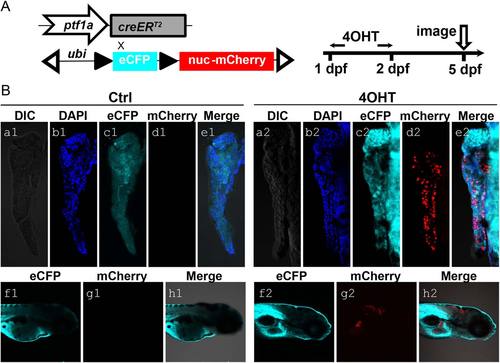
Generation of the ptf1a lineage tracing system and its initial characterization. A: Schematic diagram of ptf1a:creERT2 driver and responder ubi:loxP-CFP-loxP-nuc-mCherry. Double transgenic fish larvae were treated with 5 µM 4-OHT in E3 medium at 1 dpf for 24 hr and then fixed for imaging at 5 dpf. These larvae were raised along with untreated controls. B: At 5 dpf, no pancreatic and hindbrain nuclear-mCherry signals were detected in control larvae (a1–e1, f1–h1). 4-OHT-treated larvae showed nuclear-mCherry signal (red) in exocrine pancreas (a2–e2) and hindbrain (f2–h2), indicating ptf1a-dependent Cre activity. CFP signal (cyan) could be detected ubiquitously (c1, f1, c2, f2). DAPI (blue) stains for nuclei (b1, b2). |

The early ptf1a lineage generates a small fraction of PNC and endocrine cells. A: Experimental setup. B–G: In all the panels, ptf1a lineage is indicated by nuclear-mCherry expression (red). B, C: Immunofluorescence for Nkx6.1 (green) labels PNCs. B: In some pancreata, the ptf1a lineage and PNCs show no overlap. C: In some pancreata, ptf1a lineage–labeled cells are traced into PNCs. Arrows point to colabeling events. D: In some pancreata, the ptf1a lineage has no demonstrable contribution to endocrine cell types. ptf1a:GFP transgene (green) shows current expression of ptf1a, which, at 6 dpf, is limited to acinar cells. Endocrine cells are labeled by a mixture of antibodies against Insulin (Ins) and Glucagon (Gluc), white. E: In a few pancreata, some of the cells derived from the ptf1a lineage are co-labelled by the ins:nuc-GFP transgene (green), which is visualized in the nuclei of Insulin-secreting cells. Arrows point to co-labeling events. F: 4-OHT treatment at 6h-32hpf. In the pancreas shown, no ptf1a lineage-labeled cells can be observed in the endocrine compartment (outlined) or PNCs (Nkx6.1, green). G: 4-OHT treatment at 6h-6dpf. Nkx6.1, blue. Arrows point to ptf1a lineage-labeled endocrine cells. Arrowhead points to ptf1a lineage-labeled PNCs. Scale bar = 50 µm. |
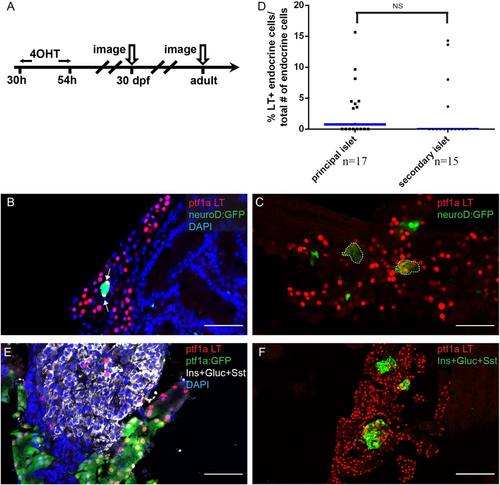
The early ptf1a lineage contributes to secondary islet and adult endocrine cells. A: Experimental setup. B, C, E, F: The ptf1a lineage is labeled by nuclear-mCherry (red). B, C: Sections from 30-dpf juvenile lineage-tracing fish. The secondary islet is labeled by the transgenic marker neuroD:GFP (green). B: Arrows point to endocrine cells expressing the ptf1a lineage mark. Notice that not all nuclei within the secondary islet are colabeled by the ptf1a lineage mark. DAPI, blue. C: Secondary islets are labeled by neuroD:GFP (green) and outlined. The secondary islets consist of a clusters of ptf1a lineage–labeled cells. D: Scatter plot shows frequency of ptf1a lineage–labeled cells traced into principal or secondary islets. T-test shows no significance. Blue bars show population median. “n” indicates the number of slides quantified for each population. E, F: Sections from adult lineage-tracing fish. The endocrine population is labeled by a mixture of antibodies against Insulin (Ins), Glucagon (Gluc), and Somatostatin (Sst). E: Some of the endocrine cells express the ptf1a lineage label. The majority of ptf1a lineage–labeled cells co-express ptf1a:GFP transgene (acinar marker). F: Selected islets consist of a cluster of ptf1a-lineage labeled cells. DAPI, blue. Scale bar = 50 µm. |

The ptf1a lineage contributes to β-cell regeneration. A: Schematic depicting the triple transgenic line utilized in the experiment. B: Experimental setup. C, D, E, F: Inserts show zoomed-in views of the principal islet region. C: In control fish with no Metronidazole (Met) treatment, the principal islet has compact architecture. Insulin (Ins), yellow. Somatostatin (Sst), cyan. Nuclei are labeled by DAPI (blue). D: Pancreatic region following 24 hr of Met treatment. The majority of Insulin-secreting cells are gone. Insulin (Ins), yellow. Somatostatin (Sst), cyan. DAPI, blue. E, F: The ptf1a lineage is labeled by nuclear-mCherry expression (red) 48 hr after removal of Met. E: In untreated fish, there are rare ptf1a lineage cells traced into the principal islet. Insulin (Ins), yellow. Somatostatin (Sst), cyan. F: In the-Met treated fish, two regenerated β cells express the ptf1a lineage label. Insulin (Ins), yellow. Somatostatin (Sst), cyan. In E and F, arrows point to Insulin+ cells that are labeled with the ptf1a lineage mark. G: Scatter plot shows quantification of ptf1a lineage–labeled cells within the endocrine compartment. No significant differences in the frequency of ptf1a lineage contributions are observed between normal and regenerating β cells. “n” indicates the number of fish quantified for each condition. Blue bars show population medium. |

Ptf1a haploinsufficiency increases the allocation of pancreatic progenitor cells to non-acinar lineages. A: The ptf1asa126 allele. This allele has an A to T transition in the first exon of ptf1a coding sequence, introducing a premature stop codon. B: Wildtype larvae, with ptf1a:GFP (green) marking acinar cells and ins:mCherry (red) transgene marking β cells. C: ptf1asa126/sa126 homozygous fish do not have exocrine pancreas. D, E: The ptf1a lineage is labeled by nuclear-mCherry expression (red). D: In ptf1asa125/wt fish, more lineage-labeled cells can be traced into Nkx6.1+ (green) PNCs. Arrows point to co-labeling events. E: In pf1asa126/wt fish, more lineage-labeled cells can be traced into the neuroD:GFP+ endocrine compartment. The principal islet is outlined. F, G: Quantification of ptf1a lineage-labeled cells contributing to PNCs, normalized by the total number of ptf1a-lineage labeled cells (F), or by the total number of PNCs (G). H, I: Quantification of ptf1a lineage–labeled cells contributing to the endocrine compartment, normalized by total number of ptf1a lineage–labeled cells (H), or by the total number of endocrine cells (I). F–I: “n” indicates the number of fish quantified for each genotype. Blue bars show population median. |
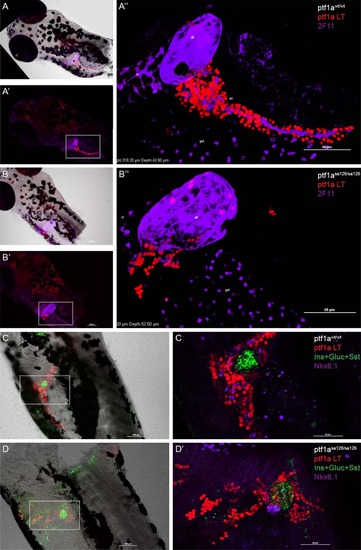
ptf1a lineage analysis in homozygous ptf1asa126/sa126 fish. In all panels, ptf1a lineage–labeled cells are shown in red. A: In wildtype zebrafish, ptf1a lineage labeling can be observed in the hindbrain and pancreas (A′). A′′ is a high-magnification, 3D-reconstructed view of the boxed region in A′. 2F11 (purple) labels gall bladder, liver, pancreatic PNCs, and some structures in the gut bulb. B: In ptf1asa126/sa126 fish, there is no exocrine pancreatic structure. Some lineage-labeled cells can be observed in the wall of gall bladder, as well as in another unidentified population adjacent to the gall bladder. B′′ is a zoomed-in view of the boxed region in B′. 2F11, purple. C,D: A mixture of antibodies against Insulin (Ins), Glucagon (Gluc), and Somatostatin (Sst) (green) labels the endocrine cell population. Nkx6.1 (purple) labels PNCs. C: In the wildtype zebrafish pancreas, the majority of lineage labeled cells are acinar cells. D: In homozygous ptf1a mutant fish, the number of PNCs is reduced and they appear at an ectopic location. ptf1a lineage–labeled cells can be detected in the principal islet and some of the PNCs. gb, gall bladder. lv, liver. |