
- Title
-
MASH1/Ascl1a Leads to GAP43 Expression and Axon Regeneration in the Adult CNS
- Authors
- Williams, R.R., Venkatesh, I., Pearse, D.D., Udvadia, A.J., Bunge, M.B.
- Source
- Full text @ PLoS One
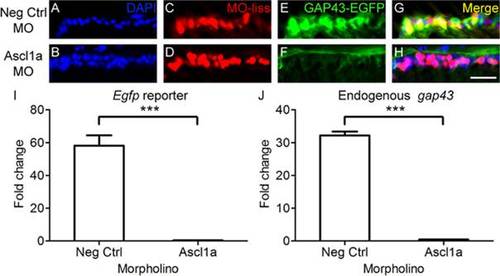
Ascl1a is required for gap43 gene expression in zebrafish. A-H, Cross sections through the retina focused on the retinal ganglion cell layer. A-D, Strong induction of gap43 expression, visualized by the EGFP reporter (C, green; D, yellow), is observed after optic nerve transection in RGCs receiving negative control MOs tagged with lissamine (MO-liss; B, red). In contrast, injury-induced gap43 expression is greatly reduced (G, green; H, yellow) in RGCs receiving Ascl1a MOs tagged with lissamine (F, red). DAPI stained nuclei are blue (scale bar = 5 µm). I, J, Relative fold change over unlesioned control represented graphically. Quantitative real-time PCR demonstrated that there was a reduction in both egfp reporter gene expression (I) and endogenous gap43 expression (J) in gap43:egfp zebrafish that received Ascl1a MOs (n = 4) after optic nerve transection compared to those that received negative control MOs (n = 4; *** = p<0.001, Mann-Whitney T-test). |
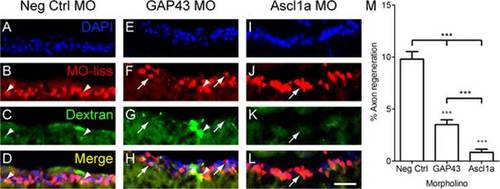
Ascl1a is required for RGC axon regeneration in zebrafish. A-L, Cross sections through the retina focused on the retinal ganglion cell layer. Four days after optic nerve transection, zebrafish RGCs that received MOs (red, arrowheads) were retrogradely traced with dextran (green) 1 mm beyond the site of injury. Animals that received negative control MOs (A-D) were able to regenerate RGC axons as evident by the co-localization of MOs and tracer (yellow, arrow). In contrast few RGCs regenerated axons in animals that received MOs to knockdown GAP43 (E-H) or Ascl1a (I-L). DAPI stained nuclei are blue (scale bar = 10 µm). M, Quantification of the percentage of RGCs that received the MOs and were able to regenerate axons. Compared to controls (n = 6), those that received either GAP43 (n = 6) or Ascl1a (n = 6) MOs exhibited a reduced percentage of RGC axons to regenerate (*** = p<0.001 one-way ANOVA; +++ = p<0.001 Bonferroni posttest). Compared to animals that received GAP43 MOs, those that received Ascl1a MOs exhibited a greater reduction in the percentage of RGC axons to regenerate (*** = p<0.001, t-test). PHENOTYPE:
|
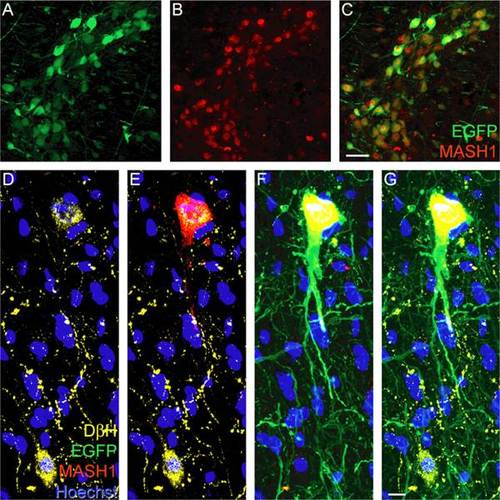
Injection of AAV-EGFP plus AAV-MASH1 induces expression of MASH1 in adult rat brainstem neurons. Immunostaining for EGFP (A, green) and MASH1 (B, red) revealed co-localization in brainstem neurons (C, yellow, scale bar = 20 µm). D, Immunostaining for DβH (yellow) revealed two noradrenergic neurons with Hoechst staining (blue) to visualize nuclei. E, Immunostaining for MASH1 (red) showed that the protein is expressed in the upper DβH-positive neuron. F, MASH1 was only expressed in neurons that also expressed EGFP (green). G, A merged image showed that the lower DβH-positive neuron was not infected with AAV and consequently did not express EGFP or MASH1 (scale bar = 5 µm). |
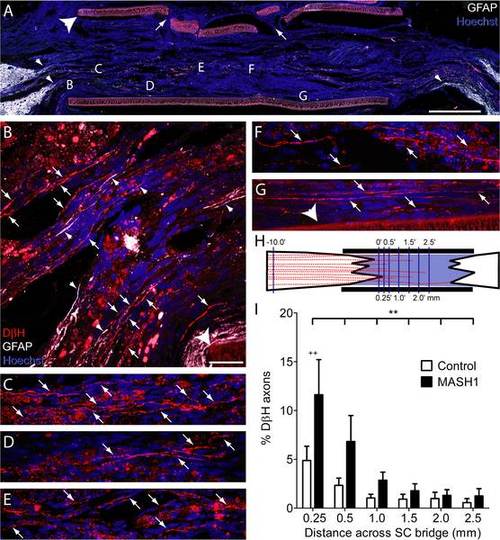
Rats treated with MASH1 exhibit increased regeneration of noradrenergic axons into the SC bridge. A, A low magnification image of a SC bridge from a MASH1 treated animal showing the rostral (left) and caudal (right) spinal cord/SC bridge interfaces delineated by GFAP-positive astrocytes (white). Note the long astrocyte processes (small arrowheads, A and B) that extend into the bridge. Hoechst-stained nuclei are blue and the large arrowhead indicates the polymer channel. Small holes (arrows) in the top of the channel were created to inject a fluid mixture of SCs and Matrigel (scale bar = 1 mm). Locations of higher magnification images taken on an adjacent section are indicated by letters (B-G). In treated animals, many beaded DβH-positive axons (red, arrows) regenerated 0.25 mm (B), 0.5 mm (C), 1.0 mm (D), 1.5 mm (E), 2.0 mm (F), and more than 2.5 mm (G), beyond the rostral spinal cord/SC bridge interface (scale bar = 20 µm). H, An illustration of the line-transect method of analysis, depicting DβH-positive axons (red) regenerating into a SC bridge. The polymer channel (thick black lines) and the transverse dorso-ventral lines used for quantification (thin purple lines) are diagrammed. The numbers represent mm from the rostral interface. I, The percentage of DβH-positive axons 10 mm rostral to the bridge that regenerated across the bridge was greater in MASH1 treated animals (n = 10) compared to control animals (n = 11; ** = p<0.01, two-way ANOVA; ++ = p<0.01 Bonferroni posttest). |
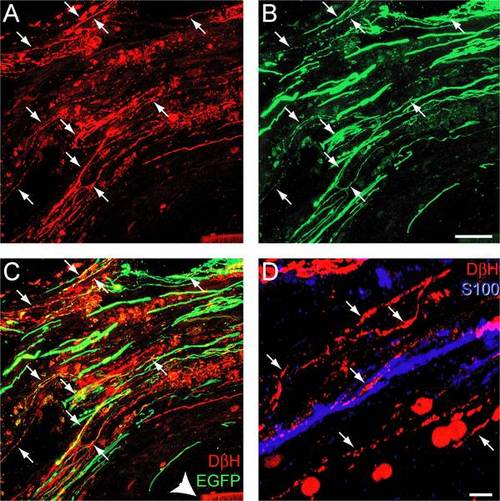
Rats treated with MASH1 exhibit EGFP expression in noradrenergic axons that regenerated into a SC bridge. A-C, Expression of DβH (red) and EGFP (green) was sometimes co-localized (arrows) in axons that regenerated past the rostral spinal cord/SC bridge interface. Arrowhead indicates the polymer channel (scale bar = 20 µm). D, DβH-positive axons (red, arrows) regenerated in close proximity to S100-positive SCs (blue; scale bar = 5 µm). |