
- Title
-
Oncogenic KRAS promotes malignant brain tumors in zebrafish
- Authors
- Ju, B., Chen, W., Orr, B.A., Spitsbergen, J.M., Jia, S., Eden, C.J., Henson, H.E., Taylor, M.R.
- Source
- Full text @ Mol. Cancer

Expression pattern ofTg(krt5:EGFP)in the adult zebrafish brain. (A) Dorsal view (anterior to the left) of a 6-month-old transgenic fish brain showing EGFP expression in the ventricular zone (VZ) of the midbrain and hindbrain (arrow). Inset shows the bright-field view of the same brain. (B) Ventral view (anterior to the left) of the same brain as in (A) showing EGFP expression in the lobus inferior (LI) of the hypothalamus (arrow) and VZ of the hindbrain. (C) A sagittal section through the adult brain showing EGFP expression in the optic tectum (OT), cerebellum (Ce), and VZ. (D) Enlarged view of framed area in (C) showing overlapping EGFP expression and antibody staining for the radial glia marker S100β (red). Scale bars, 200 µm for A-C; 20 µm for D. EXPRESSION / LABELING:
|

Transient expression of oncogenic KRAS results in tumorigenesis in the brain region. (A) Graphic representation of driver and effector DNA constructs used for co-injection into zebrafish eggs. (B, B′) The krt5 gene promoter directed prominent transgenic expression in skin epithelial cells and other cell types, whereas the gfap promoter directed expression primarily in the CNS. (C, C′) A 9-day old krt5-transgenic fish showing focal expression of the oncogenic mCherry-KRAS in the head (outlined in white). (D, D′) A krt5-transgenic fish at 2 months of age showed gross tumor infiltration within the head. (E, E′) A gfap-transgenic fish at 2 months of age showed similar tumor infiltration in the head. (F) Both krt5- and gfap-transgenic fish developed tumors within the head region at approximately 50% penetrance by 15 months of age. Scale bars, 0.5 cm. |

Histological and immunohistological analyses of tumors fromkrt5andgfaptransgenic fish. (A) H&E staining of a sagittal section from a 6-month-old krt5-derived tumor showing tumor cells originating from and infiltrating the VZ of the optic tectum (OT), as highlighted by the dotted line. (B) Enlarged view of the white frame in (A) demonstrating infiltrating malignant cells with moderate pleomorphism, typical of high-grade astrocytoma. (C) A 6-month-old gfap-transgenic fish brain showing tumor development in both the VZ (broken line) and the brain parenchyma (arrow). gfap:KRASG12V-derived brain tumors exhibited phenotypes consistent with malignant glioma including frequent mitotic figures (D) and focal necrosis (E, F). N, necrosis. Scale bars, 100 µm for A; 20 µm for B, D, E and F; 40 µm for C. |

Activation of the Ras and mTOR pathways in brain tumors. (A) A 6-month-old krt5-derived brain tumor infiltrating both the ventral brain and the VZ. Tumor cells exhibited prominent expression of phospho-ERK1/2 (B) and phospho-4E-BP1 (C). (B) and (C) show immunofluorescence staining of the white framed region in (A). Note the relatively normal cerebellum exhibited much less staining for the two antibodies. (D) A 12-month-old gfap-derived brain tumor showed tumor cell infiltration of the VZ surrounding the OT. Tumor cells exhibited prominent expression of pERK1/2 (E) and pS6RP (F). Note that paraffin sections were used for immunofluorescence. Ce, cerebellum; OT, Optic tectum. Scale bars, 200 µm for A; 40 µm for B, C, D, and E. |
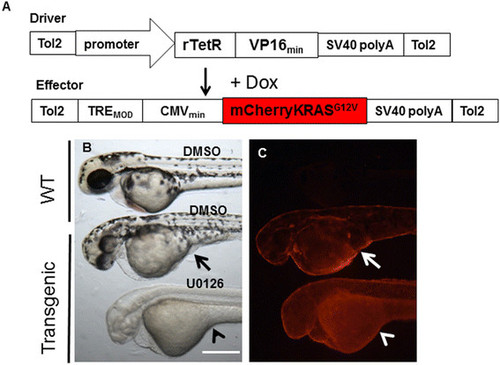
MEK inhibitor U0126 suppresses proliferative effect of oncogenic KRAS in skin epithelial cells. (A) Graphic representation of driver and effector DNA constructs for generation of Dox-inducible stable transgenic lines. (B, C) In an inducible Tg(krt5:rtTA:mCherryKRASG12V) transgenic line, 48hpf larvae treated with 10 µg/ml Dox showed skin hyperplasia, most noticeably under the yolk sac (arrows). 50 µM U0126 treatment completely eliminated the skin hyperplasia (arrow heads). Scale bar, 250 µm. |

Oncogenic KRAS expression in CNS increases mitotic activity in the spinal cords. (A, B) 120hpf larvae from an inducible Tg(gfap:rtTA:mCherryKRASG12V) line showed heart edema (arrow), body curvature, and hyperpigmentation of the trunk. At 72hpf, wild-type larvae showed prominent expression of GFAP in the spinal cord (C), and few cells were undergoing mitosis (D). Expression of oncogenic KRAS disrupted the normal GFAP expression pattern in the spinal cord (E), and significantly increased the number of cells undergoing mitosis (F, arrows). SC, spinal cord. Scale bars, 250 µm. EXPRESSION / LABELING:
PHENOTYPE:
|