
- Title
-
Hedgehog signaling regulates dental papilla formation and tooth size during zebrafish odontogenesis
- Authors
- Yu, J.C., Fox, Z.D., Crimp, J.L., Littleford, H.E., Jowdry, A.L., Jackman, W.R.
- Source
- Full text @ Dev. Dyn.

Fluorescence visualization of cellular details during tooth germ morphogenesis. A,E,I: Ventral views, anterior to the left, of the zebrafish pharyngeal region. B,C,F,G,J,K: Closeups of right-side tooth germs. A,B,E,F,I,J: Four-color stains of dlx2b:GFP reporter expression (green), laminin protein (yellow), f-actin (red), and DNA (blue). C,G,K: Two-color stains with dlx2b:GFP (green) and DNA (magenta). A,B: Laminin expression at 48 hpf and 56 hpf stages at the boundaries of the pharyngeal arches (a3–a5) as well as the interface between the dental epithelium and dental mesenchyme of tooth germ #1 (B, arrow). C: dlx2b:GFP reporter expression mostly in the inner dental epithelium (arrow). D: Schematic drawing of a early morphogenesis stage tooth germ #1 at 48 hpf. E,F: Laminin expression highlighting the outer dental epithelium in a late morphogenesis stage tooth germ #1 at 56 hpf (F, arrow). G,H: dlx2b:GFP expression in the inner dental epithelium and schematic drawing. I,J: F-actin staining along with dlx2b:GFP expression in cell differentiation stage tooth germ #1 at 72 hpf. Tooth germs #2 and #3 are also present. K: dlx2b:GFP expression in the inner dental epithelium and the dental papilla (arrow) at 72 hpf. Tooth germs #2 and #3 are mostly outside the focal plane in this specimen. L: Schematic drawing of typical orientations of the tooth germs at 72 hpf. Scale bars = 10 µm in A–C. |
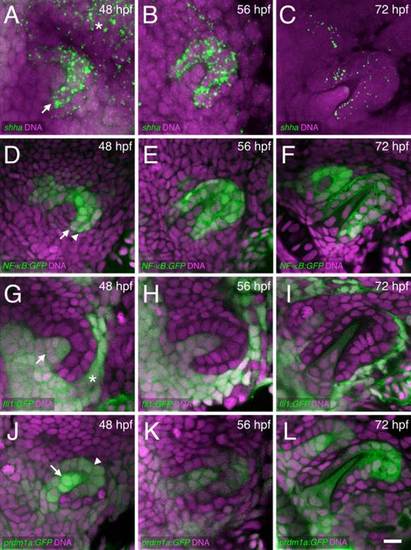
Cellular details of hedgehog epithelial expression and tooth germ morphogenesis. Ventral views, anterior to the left, of right-side tooth germs. DNA is stained in magenta. A–C: shha mRNA FISH (green) with expression visible in the inner dental epithelium (arrow) and nearby pharyngeal epithelium (asterisk). D–F: NF-κB:GFP reporter expression in both the inner (arrow) and outer dental epithelium (arrowhead). G–I: fli1:GFP expression in the dental papilla (arrow) and nearby nondental mesenchyme (asterisk). J–L: prdm1a:GFP expression in both the dental papilla (arrow) and in distal parts of the dental epithelium (arrowhead), with papilla expression appearing relatively higher at 48 hpf. Scale bar = 10 µm in L. |

Hedgehog signaling is required for dental papilla formation. A–C: dlx2b:GFP expression in normal-appearing tooth germs exposed to 0.2% EtOH as a control from 32 or 36–72 hpf. The base of the dental papilla of tooth #1 is indicated (C, arrow). D–F: Tooth forming region after 50 µM CyA exposure from 30 or 32–72 hpf, showing a few disorganized-appearing GFP-positive cells (arrows). G,H: Tooth germ after later CyA treatment from 36–72 hpf lacking a dental papilla (arrow). I: Tooth germ after CyA exposure from 48–72 hpf, with a smaller than normal dental papilla (arrow). J: Graph of dental papilla cell numbers at 72 hpf. Gray dots represent individual counts, central bars are the mean, and flanking error bars indicate standard error. All three pairwise comparisons are significantly different. Tooth germ orientations are as in Figure 1. Scale bars = 10 µm. |
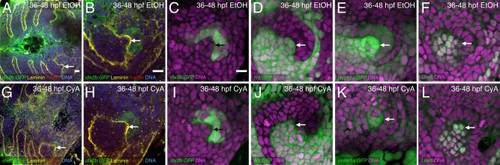
Hedgehog inhibition starting at 36 hpf does not prevent early dental papilla formation. A–L: Tooth germ #1 after 36–48 hpf EtOH control (A–F) or CyA exposure (G–L). Arrows indicate the dental papilla. Stains are as described in Figures 1 and 2 with the addition of an Lhx6 antibody stain marking the dental papilla and adjacent nondental mesenchyme (F,L). In all cases early dental papilla formation is visible in CyA treated tooth germs, but its shape does not always appear normal. Scale bars = 10 µm in A–C. |

Hedgehog inhibition induces unusual late tooth germ apoptosis but proliferation appears relatively normal. A–J: Antibody labels (magenta) for pH3 (proliferation; A,B,F,G) or Caspase 3 (apoptosis; C–E,H–J) in the dlx2b:GFP reporter line (green) with DNA label (gray). Treatments are EtOH control (A–E) or with CyA exposure starting at 36 hpf (F–J). pH3 proliferation staining at or near the base of the dental epithelium in control (A) and CyA treated (F) tooth germs at 54 hpf (arrows). Proliferation is visible in a 72 hpf control tooth germ (arrow, B), but only background staining is seen after CyA treatment (G). C–E: Caspase 3 apoptosis staining is absent from control tooth germs, except near the tip of tooth #1 at 72 hpf (arrow, D). Apoptosis can be seen in the tooth forming region after 36–52 hpf CyA exposure but not localized to the tooth germ (arrow, H). Caspase 3-positive cells in the dental epithelium after 36–60 hpf CyA treatment (arrow, I). An apoptotic cell is visible in the base of the tooth germ after 36–72 hpf CyA exposure (arrow, J). Tooth germ orientations are as in Figure 1. Scale bar = 10 µm in J. |
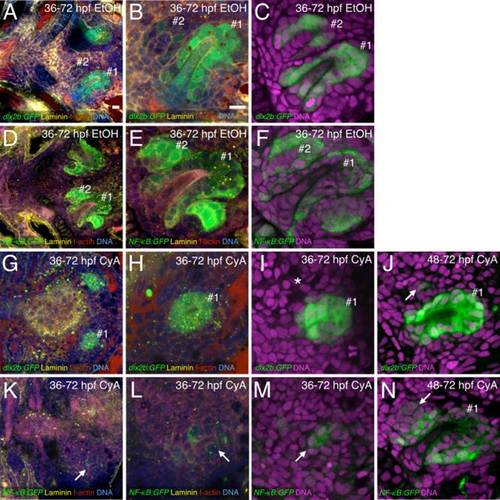
Blocking hedgehog signaling restricts subsequent tooth initiation. Tooth germ dental epithelium labeled with dlx2b:GFP (A–C,G–J) and NF-KB:GFP (D–F,K–N). A–F: Tooth germs #1 and #2 in control transgenic individuals. G–I: 36–72 hpf CyA treated individuals with dlx2b:GFP expression in the position of tooth germ #1 but no evidence of tooth germ #2 (asterisk I). J: 48–72 hpf CyA treated individual with a single dlx2b:GFP+ cell in the position of tooth germ #2 (arrow). K–M: NF-κB:GFP individuals after 36–72 hpf CyA treatment with very weak and disorganized GFP expression in the tooth-forming region (arrows). N: Cluster of NF-κB:GFP expressing cells in the position of tooth germ #2 after 48–72 hpf CyA treatment (arrow). Additional stains and tooth germ orientations are as in Fig. 1. Scale bars = 10 µm in A,B. |
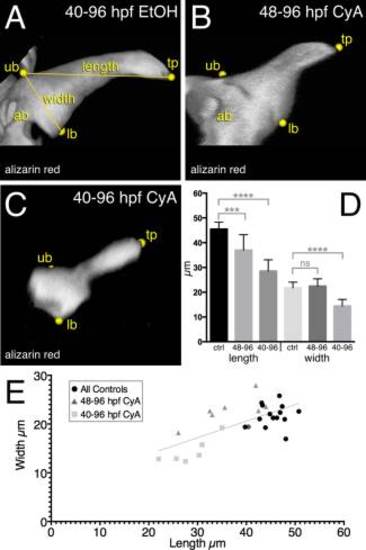
Reduction in mineralized tooth size associated with hedgehog inhibition. A–C: 3D renderings of 96 hpf mineralized tooth #1 using alizarin red staining and confocal microscopy. A: 40–96 hpf EtOH treated control tooth #1. B: 48–96 hpf CyA exposed tooth. C: 40–96 hpf CyA treated tooth. Labels: tp, tooth tip; ub, upper point of base; lb, lower base; ab, attachment bone. D: Graph of measurement means. Error bars = standard deviation. E: XY plot of all measurements. Best fit line is shown (R2 = 0.46; P < 0.0001). Significance tests: ***P < 0.001; ****P < 0.0001; ns = not significant. |