
- Title
-
Firing Dynamics and Modulatory Actions of Supraspinal Dopaminergic Neurons during Zebrafish Locomotor Behavior
- Authors
- Jay, M., De Faveri, F., McDearmid, J.R.
- Source
- Full text @ Curr. Biol.
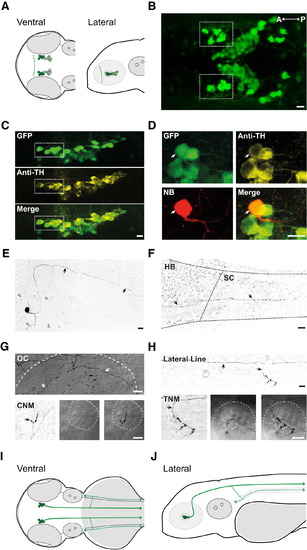
Identification of DDNs in the Diencephalon of ETvmat2:GFP Zebrafish Larvae at 4 dpf (A) Ventral (left) and lateral (right) schematic overview of DC2 (dark green) and DC4/5 (light green) neurons in the diencephalon (dashed line represents the anterior diencephalic border) of 4 dpf larvae. (B) Ventral view of GFP-labeled cells in the diencephalon. Prospective DDNs in DC2 comprise a small cluster of strongly fluorescent, large-diameter cells (dashed boxes) near the anterior aspect of the diencephalon. (C) Lateral images of the posterior tuberculum labeled with GFP (green, top) and anti-tyrosine hydroxylase antibodies (Anti-TH, yellow, middle). Merged image (bottom) reveals that all large, GFP-positive neurons in the anterior aspect of posterior tuberculum are immunoreactive for TH. (D) Lateral view of a GFP-expressing neuron in the anterior posterior tuberculum (green) labeled with neurobiotin (NB, red) and co-stained with anti-tyrosine hydroxylase antibodies (Anti-TH, yellow). Merged image (bottom right) reveals NB-labeled cells are GFP and TH positive. (E and F) Lower-magnification contrast inverted composite images of the same NB-labeled neuron in (D) depicting the soma and primary axon in the diencephalon (E; arrows) and the primary axon (F; arrows) extending from the hindbrain (HB) to the spinal cord (SC). Extensive axonal arborization is observed near the soma (arrow heads in E). (G and H) At the level of the hindbrain, the primary axon branches into the periphery, innervating the otic capsule (OC, top in G), cranial neuromasts (CNM, bottom in G), lateral line (top in H), and trunk neuromasts (TNM, bottom in H). White dashed lines in (G) and (H) mark the OC (top) and CNM and TNM (bottom). Bottom panels in (G) and (H) depict contrast-inverted image of NB labeling (left), bright field (middle), and merged NB-bright field images (right). (I and J) Ventral (I) and lateral (J) schematic overviews of DDNs and their arborization patterns. Axons project caudally into the spinal cord (solid green lines) and into the periphery (dashed green lines). In (B)–(H), anterior is left and posterior is right. In (C)–(H), dorsal is up and ventral is down. Scale bars in (B)–(H) represent 10 µm. (A), (I), and (J) are not to scale. |

Effects of DDN Ablation on Zebrafish Behavior (A and B) Ventral views of GFP (left), anti-tyrosine hydroxylase (anti-TH; middle), and merged GFP/anti-TH (right) labeling in the diencephalon of control (A) and ablated (B) ETvmat2:GFP larvae at 4 dpf. Note that the anterior-most neurons corresponding to DDNs in DC2 (arrowheads in A) are absent in ablated fish. (C) Swimming trajectories of 4 dpf control and laser ablated zebrafish recorded over a 10 min period. (D) Left: cumulative distance that individual control (black) and laser-ablated (red) fish travel over the 10 min period. Right: box-and-whisker plot of total distance traveled in 10 min period for control and laser-ablated 4 dpf larvae. (E and F) Raster plots of identified episodes of beat-glide swimming in non-ablated (E) and ablated (F) 4 dpf larvae over the 10 min recording (top). Bottom: corresponding regions of raster plots over an expanded timescale. Each row represents a single fish during the recording. (G and H) Box-and-whisker plots of the percent of time spent beat-glide swimming over the 10 min observation period (G) and the duration of individual beat-glide bouts (H). (I) Plots of average velocity as a function of time for bouts of beat-glide activity. At the onset of the beat period (black arrow), velocity increases sharply and subsequently declines to baseline levels during the glide period. For box-and-whisker plots in (D), (G), and (H), filled circles depict raw data points; upper and lower hinges of the box correspond to the first and third quartiles; whiskers extend to 1.5× the interquartile range; and lines within boxes represent median. Scale bars of (A) and (B) represent 10 µm; anterior is left, posterior is right. See also Figures S4 and S5. |