
- Title
-
Loss of cftr function leads to pancreatic destruction in larval zebrafish
- Authors
- Navis, A., Bagnat, M.
- Source
- Full text @ Dev. Biol.

cftr is expressed in the pancreatic duct. (A–D) Wholemount in situ hybridization for cftr. (A) Dorsal and (B) lateral view of cftr expression at 3 dpf. (C) Dorsal and (D) lateral view of cftr expression at 5 dpf. (E and F) Transverse section of TgBAC(cftr-GFP) expressed in the pancreatic duct at (E) 3 dpf in conjunction with ptf1a expression in the acinar cells of the pancreas and (F) at 5 dpf in conjunction with ZN-5, an antibody that marks the pancreas. (G) Live, confocal image of TgBAC(cftr-GFP) expression along the length of the pancreatic duct in conjunction with Tg(ins:dsRed) to mark the β cells of the principal islet at 5 dpf. (H) Live confocal image of ductal TgBAC(cftr-RFP) expression in conjunction with ela:GFP to indicate the acinar tissue. White arrows indicate cftr expression in the pancreatic duct. ib: intestinal bulb, ov: otic vesicle, p: pancreas. (A–D) Scale bars=100 µm, (E–H) Scale bars=50 µm. EXPRESSION / LABELING:
|

Cftr is localized to the apical membrane of the pancreatic duct epithelium throughout life. (A and A′) Transverse section of 5 dpf larvae expressing TgBAC(cftr-RFP) to show Cftr-RFP localization and TgBAC(cftr:Gal4); Tg(UAS:GFP) to mark the cytosol of cftr expressing cells with GFP. Dashed white lines indicate the periphery of pancreas. Inset is 3× magnification of ductal cells. ib: intestinal bulb. (B and B′) Transverse section of a 21 dpf larvae demonstrating Cftr-RFP localization at the apical membrane of the pancreatic duct in conjunction with TgBAC(ptf1a-GFP) expressed in the acinar cells. Cftr is observed at or near the apical membrane marked with phalloidin. (C and C2) Transverse section of 3 month, adult pancreas indicating Cftr-GFP expression in pancreatic ducts throughout the pancreas. Dashed white lines indicate the periphery of the pancreas. Red dashed box indicates inset (D). (D and D′) Cftr-GFP is localized at or near the apical membrane of the pancreatic ducts, marked by phalloidin staining. Arrows indicate ductal expression of Cftr. Scale bars=50 µm. |

Development of thecftr mutant pancreas. (A) Wholemount confocal image of WT pancreas stained with anti-carboxypeptidase (CP-A) to detect acinar cells and phalloidin to mark actin at the apical membrane of the pancreatic duct. (A′) Associated WT image without anti-CP-A to better visualize the contiguous actin strip along the length of the duct indicative of a continuous lumen. (B) Wholemount confocal image of a cftr pancreas stained with anti-CP-A and phalloidin. The actin network is contiguous in cftr mutants indicative of a continuous lumen. (C–F) Wholemount WT and cftr mutant samples expressing ela:GFP to mark acinar tissue and stained with DAPI to mark nuclei at (C and D) 5 dpf and (E and F) 10 dpf. (G) Quantification of principal islet β cells at several stages. (H) Quantification of total number of secondary islets at 14 dpf and (I) total number of secondary β cells at 14 dpf. WT, n=7; cftrpd1049n=6. (J) Quantification of DAPT induced secondary islets and (K) total number of DAPT induced secondary islet β cells. WT, n=5; cftrpd1049, n=4. Error bars represent s.e.m. Scale bars=50 µm. PHENOTYPE:
|
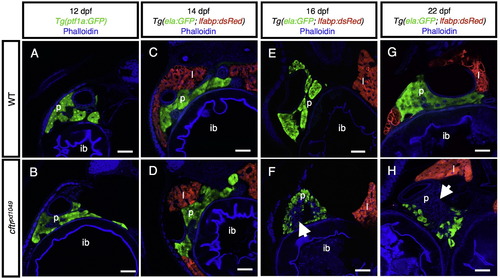
Timecourse of pancreatic destruction incftr mutants. (A and B) Transverse section of Tg(ptf1a:GFP) expression marking the acinar cells in (A) WT and (B) cftr mutant samples. (C and D) Transverse section at 14 dpf of (C) WT and (D) cftr mutant pancreas marked by ela:GFP expression. (E and F) Transverse section of (E) WT and (F) cftr mutant samples expressing ela:GFP in the acini demonstrating loss of pancreatic acinar tissue at 16 dpf. (G and H) Transverse section of (G) WT and (H) cftr mutant samples expressing ela:GFP in the pancreas at 22 dpf with severe pancreatic destruction. Arrow indicates absent acinar tissue. Scale bars=50 µm. EXPRESSION / LABELING:
PHENOTYPE:
|

Adult cftr mutants undergo severe pancreatic destruction. (A and B) Transverse section of (A) WT and (B) cftrpd1049 mutant pancreas expressing ela:GFP in acinar cells. (C and D) Transverse section of 3 month post fertilization (mpf) WT and cftr mutant pancreas stained for insulin and glucagon to mark the pancreatic islets. (E–H) Hematoxylin and eosin staining of WT and cftr mutant pancreatic sections at (E and F) 3 mpf and (G and H) 1 year post fertilization. (I and J) Period Acid Schiff staining of 3 mpf transverse sections of the pancreas indicating mucus within the lumen of the pancreatic duct. Arrows indicate dilated pancreatic ducts. ib: intestinal bulb, p: pancreas, l: liver. Scale bars=50 µm. PHENOTYPE:
|
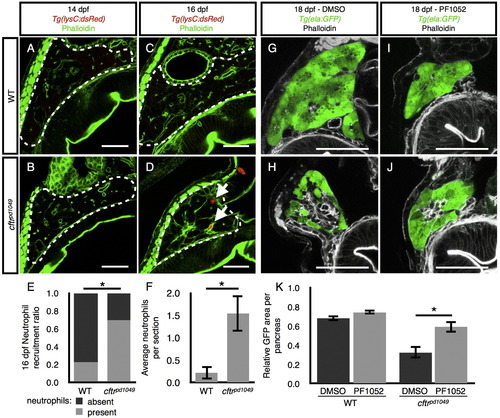
Neutrophil recruitment during pancreatic destruction. (A and B) Neutrophils are absent from representative sections of (A) WT and (B) cftr mutant pancreata at 14 dpf. (C and D) Neutrophils are absent from the (C) WT pancreas at 16 dpf, but present in the (D) cftr mutant pancreas. (E and F) Quantification of (E) the ratio of sections with neutrophils present versus absent to the total number of sections and (F) the average number of neutrophils observed in each pancreas indicating a significant difference in pancreatic neutrophils in the 16 dpf cftr mutant pancreas. The median number of neutrophils in each WT pancreas was 0, ranging from 0 to 1 and cftrpd1049 was 1, ranging from 0 to 5. WT, n=8; cftrpd1049, n=13; *P<0.01. Error bars represent s.e.m. (G and H) DMSO treated (G) WT and (H) cftr mutant samples at 18 dpf expressing ela:GFP in the acinar cells demonstrate typical pancreatic destruction. (I and J) Representative sections of (I) WT and (J) cftr mutant pancreata at 18 dpf treated with PF1052 showing preservation of acinar tissue. (K) Quantification of area of GFP expression divided by total pancreas area for each treatment group showings significantly more area of acinar tissue marked by ela:GFP in PF1052 treated mutants compared with DMSO treated mutants. WT DMSO, n=8; WT PF1052, n=7; cftrpd1049 DMSO, n=8; cftrpd1049, n=12; *P<0.01. Error bars represent s.e.m. Arrows indicate neutrophils. Scale bars=50 µm. EXPRESSION / LABELING:
PHENOTYPE:
|
Reprinted from Developmental Biology, 399(2), Navis, A., Bagnat, M., Loss of cftr function leads to pancreatic destruction in larval zebrafish, 237-48, Copyright (2015) with permission from Elsevier. Full text @ Dev. Biol.