
- Title
-
Down syndrome critical region protein 5 regulates membrane localization of Wnt receptors, Dishevelled stability and convergent extension in vertebrate embryos
- Authors
- Shao, M., Liu, Z.Z., Wang, C.D., Li, H.Y., Carron, C., Zhang, H.W., and Shi, D.L.
- Source
- Full text @ Development
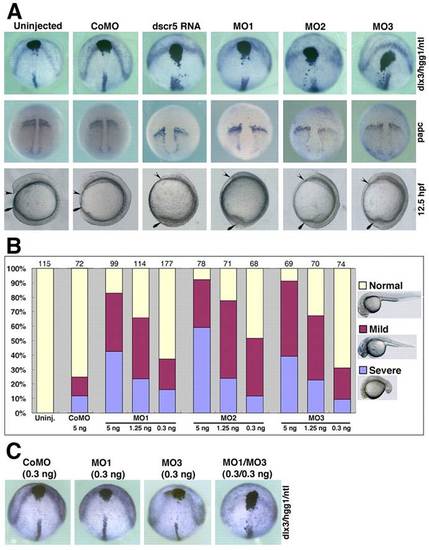
Overexpression or knockdown of dscr5 impairs CE movements. (A) Embryos were injected with dscr5 RNA or different MOs, as indicated. In situ hybridization was performed at 100% epiboly using the indicated probes, and live images were taken at 12.5 hpf. Upper panel, dorsoanterior view shows embryos simultaneously hybridized with dlx3, hgg1 and ntl probes; middle panel, dorsal view shows the expression domain of papc; bottom panel, lateral view shows the phenotypes of embryos at 12.5 hpf, with anterior to the top and dorsal side to the right. Arrowheads and arrows denote the anterior tip of the hypoblast and the tail region, respectively. (B) Summary of the dose-dependent effects of dscr5 knockdown using different MOs. Numbers at the top indicate total embryos scored at 27 hpf from three independent experiments. (C) Embryos were injected with a low dose of the indicated MOs and simultaneously hybridized with dlx3, hgg1 and ntl probes at 100% epiboly. |
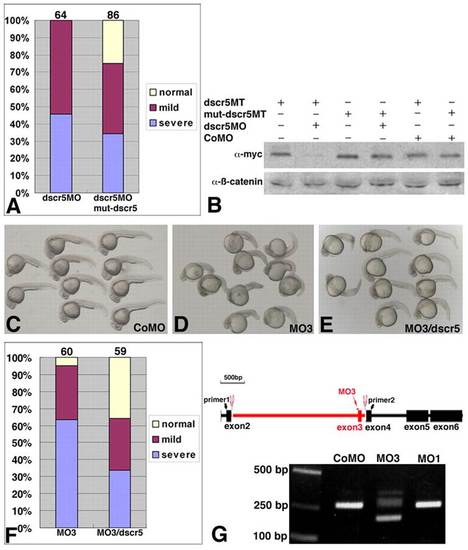
Specificity and effectiveness of dscr5 MOs. (A) Rescue of CE defects in dscr5 morphants by mut-dscr5 RNA. Summary of the phenotypes at 25 hpf with numbers at the top indicating total embryos scored from four independent experiments. (B) Western blot analysis of the effect of dscr5MO on the translation of dscr5MT and mut-dscr5MT RNAs. Endogenous β-Catenin was used as a loading control. (C-F) Rescue of CE defects in embryos injected with MO3 and cultured to 27 hpf. (C) CoMO-injected embryos. (D) MO3-injected embryos. (E) Embryos coinjected with MO3 and dscr5 RNA. (F) Summary of the rescue from three experiments, with the number of total embryos indicated at the top. (G) Schematic representation and RT-PCR analysis at 12.5 hpf of MO3-induced mis-splicing of dscr5 pre-mRNA. PHENOTYPE:
|
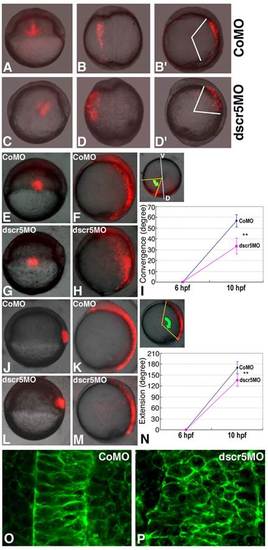
Convergence and extension movements are affected in dscr5 morphants. (A-D2) Transplantations of RLDx-labeled cells from the margin of shield stage embryos injected with CoMO or dscr5MO to the corresponding region in wild-type recipients. (A) A 6 hpf recipient embryo with CoMO-injected cells. (B,B′) Dorsal (B) and lateral (B2) views of the embryo in A developed to 10 hpf. (C) A 6 hpf recipient embryo with dscr5MO-injected cells. (D,D′) Dorsal (D) and lateral (D2) views of the embryo in C developed to 10 hpf. (E-N) Analysis of the convergence of lateral mesendodermal cells (E-I) and the extension of axial mesendodermal cells (J-N) in embryos injected with CoMO (E,F,J,K) or dscr5MO (G,H,L,M) using a photo-conversion strategy. (E-I) Labeled lateral mesendodermal cells at the shield stage in embryos injected with CoMO (E) or dscr5MO (G) were analyzed at the bud stage (F,H,I). Lateral view for all embryos except the inset in I, which is an animal pole view showing the angle between the labeled cells and the line perpendicular to the dorsoventral axis (green arrow). (J-N) Labeled axial mesendodermal cells at the shield stage in embryos injected with CoMO (J) or dscr5MO (L) were analyzed at the bud stage (K,M,N). Lateral view for all embryos; the inset in N shows the angle between the most anterior and the most posterior labeled cells (green arrow). Green dot represents the center of the images. Quantification of the convergence of lateral cells (I) and the extension of dorsal cells (N) was performed using five embryos for each condition. Asterisks indicate statistically significant differences (P<0.001, Student′s t-test), error bars indicate standard deviation. D, dorsal region; V, ventral region. (O,P) Analysis of cell intercalation in the notochord by confocal microscopy. Representative images from a control embryo (O) and a dscr5 morphant (P) at the bud stage. |
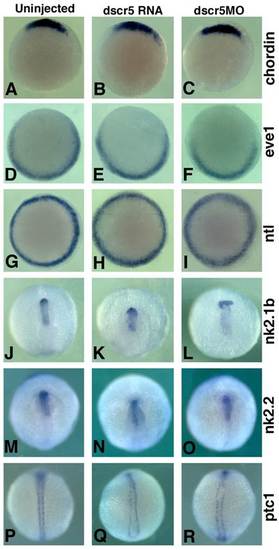
Overexpression or knockdown of dscr5 has no effect on mesoderm and neural patterning. Embryos were injected as indicated and in situ hybridization was performed using the indicated markers. (A-I) Animal pole view shows the expression pattern of chordin (A-C), eve1 (D-F) and ntl (G-I) at 50% epiboly. (J-R) Dorsoanterior view (J-O) and dorsal view (P-R), with anterior to the top, show the expression pattern of nk2.1b (J-L), nk2.2 (M-O) and patched 1 (ptc1) (P-R) at 12.5 hpf. Note the broader neuroectoderm stained by ptc1 in dscr5 RNA- and dscr5MO-injected embryos. EXPRESSION / LABELING:
|

Interaction between Dscr5 and the PCP pathway in CE movements. (A) Rescue of CE movements by dshΔDIX in dscr5 morphants. Summary of three independent experiments of phenotypic analysis at 27 hpf with total numbers indicated at the top. (B-F) Inhibition of the JNK pathway and dscr5 knockdown enhances CE defects. (B-E) Control (B) and injected (C-E) embryos at the eight-somite stage simultaneously hybridized with myoD and dlx3 probes. Dorsoanterior view of dlx3 expression pattern. myoD expression pattern was used to control the stage of injected embryos and was not shown. (F) Summary of the phenotypes at 27 hpf. Numbers at the top represent total embryos scored from four independent experiments. (G) Knockdown of dscr5 by MO1 or MO3 inhibits JNK activation. The AP1-luciferase reporter assay was performed in triplicate (P<0.03, Student′s t-test). Error bars indicate standard deviation. EXPRESSION / LABELING:
PHENOTYPE:
|

Disruption of the membrane localization of Knypek and Frizzled 7 receptors in dscr5 morphants. (A) Localization of Kny-Myc at the cell surface and in the cytoplasm. (B) Kny-Myc distribution in dscr5-knockdown cells. (C) Western blot analysis of Kny-Myc levels in the culture medium (left) and cell pellets (right) of dscr5 RNA- or dscr5MO-injected cells. GFP protein was used as a loading control in the cell pellets and to monitor the integrity of the cultured cells. (D,E) XFz7-Myc localization revealed by Cy3-conjugated secondary antibody. (D) Localization of XFz7-Myc to the cell membrane of control cells. (E) XFz7-Myc distribution in dscr5-knockdown cells. (F) Caveolin-GFP localization in dscr5-knockdown cells. (G) Merge of E and F showing the colocalization between XFz7-Myc and Caveolin-GFP. (H-K) Rescue of XFz7-Myc membrane localization by dn-caveolin in cells injected with dscr5MO (I) or gly4ΔC RNA (K). |

Functional interaction between Dscr5 and Knypek/Glypican 4. (A-L) Comparison of CE defects in control embryos (A-C) and following injection of dscr5MO (D-F), knyMO (G-I) and gly4ΔC RNA (J-L), as indicated on the right. (A,A′,D,D′,G,G′,J,J′) Embryos at the eight-somite stage were simultaneously hybridized with myoD and dlx3 probes. Dorsal view (A,D,G,J) shows the expression of myoD, and dorsoanterior view (A′,D′,G′,J′) shows the expression of dlx3. (B,E,H,K) Live images at 12.5 hpf with anterior to the top and dorsal side to the left. Arrowheads and arrows denote the anterior tip of the hypoblast and the tail region, respectively. (C,F,I,L) Live images at 27 hpf with anterior to the right. (M-O) Rescue by gly4ΔC of CE movements in Xenopus animal cap explants overexpressing dscr5. Uninjected (M), dscr5RNA-injected (N), and dscr5RNA- and gly4ΔC-coinjected (O) embryos. (P) Rescue by knypek knockdown or gly4ΔC overexpression of CE movements in zebrafish whole embryos overexpressing dscr5. The phenotypes were scored at 25 hpf from three independent experiments, with total numbers indicated at the top. EXPRESSION / LABELING:
PHENOTYPE:
|
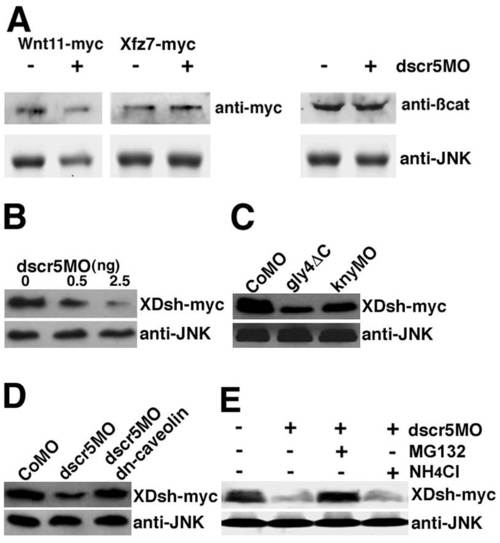
Rescue of Dishevelled stability by dn-caveolin and proteosome inhibitor. Western blot analysis of XDsh-Myc at the shield stage of zebrafish embryos. (A) Absence of effect of dscr5 knockdown on the stability of Wnt11-Myc, XFz7-Myc and endogenous β-Catenin. (B) Dose-dependent effect of dscr5 knockdown on XDsh-Myc stability. (C) XDsh-Myc degradation in embryos injected with gly4ΔC RNA or knyMO. (D) Coexpression of dn-caveolin rescues XDsh-Myc stability in dscr5 morphants. (E) MG132, but not NH4Cl, maintains XDsh-Myc stability in dscr5 knockdown cells. Endogenous JNK was used as a loading control. |

Comparison of Dscr5 protein sequences in different species and the expression pattern of zebrafish dscr5 RNA. (A) Alignment of Dscr5 protein sequences from different species. The two putative transmembrane domains are underlined. (B) Analysis by in situ hybridization of zebrafish dscr5 expression at different early stages. A corresponding section is shown on the right side of each whole-mount embryo. EXPRESSION / LABELING:
|