
- Title
-
Proper migration and axon outgrowth of zebrafish cranial motoneuron subpopulations require the cell adhesion molecule MDGA2A
- Authors
- Ingold, E., Vom Berg-Maurer, C.M., Burckhardt, C.J., Lehnherr, A., Rieder, P., Keller, P.J., Stelzer, E.H., Greber, U.F., Neuhauss, S.C., Gesemann, M.
- Source
- Full text @ Biol. Open
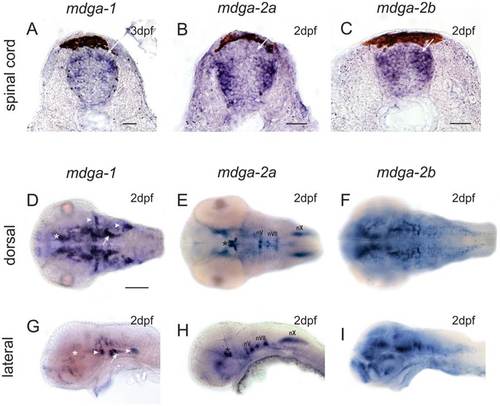
(A-C) Cross-section through larval zebrafish spinal cords. MDGA1 and MDGA2B staining can be observed at regions where dorsal commissural interneurons are located (white arrow). Additional staining for MDGA2A and MDGA2B can be observed in pools of intermediate and ventral interneuron. MDGA1 positive cells can be found in a narrow band of mediolateral located interneurons. Scale bars represent 25µm. (D–F) Dorsal and (G–I) lateral view of MDGA whole mount in situ hybridizations of 2dpf larval zebrafish. MDGA1 riboprobes label the ventral thalamus (asterisks in D,G) and the hypothalamus (arrow in D,G). Three well discernible cell clusters in the peripheral nervous system, namely the anterior and posterior lateral line ganglia as well as cells associated with the otic placode such as cells of the statoacoustic ganglion (gVIII) also prominently express MDGA1 (arrowheads in D,G). MDGA2A transcripts can be found in the motoneurons of the oculomotor (nIII) and trochlear (nIV) nerve in the midbrain (asterisks in E,H), as well as branchiomotoneurons of the trigeminal, facial and vagal nerve in the hindbrain (E,H, nV/nVII/nX). MDGA2B is expressed in the telencephalon, the ventral thalamus, the tegmentum, the hypothalamus and at low levels also in subpopulation (nVII and nX) of cranial motoneurons (F,I). Scale bars in D equals 100µm. EXPRESSION / LABELING:
|
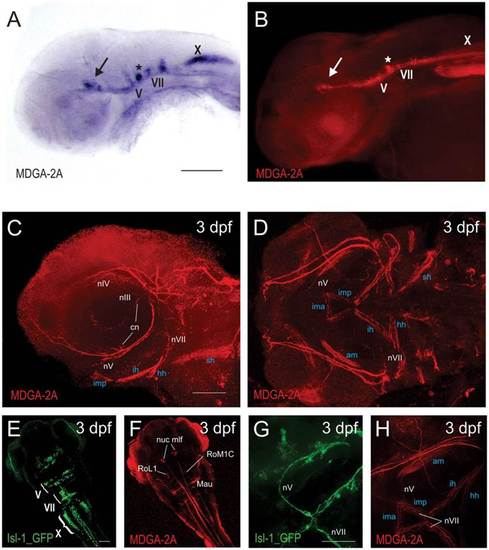
(A,B) Comparison between MDGA2A RNA and protein distribution demonstrates that the MDGA2A antibody highlights identical structures as seen with MDGA2A riboprobes. Neurons and axons of the oculomotor (arrow), the trigeminal (V) and the facial (VII) nerve are clearly MDGA2A positive (A,B). (C,D,F,H) At 3dpf MDGA2A is located on specific nerves. MDGA2A antibodies highlight branches of the ciliary nerve (cn), the oculomotor nerve (nIII), the trochlear cranial nerve (nIV), several branches of the trigeminal nerve (nV) and the facial nerve (nVII) (C,D). MDGA2A positive nV axons run ventrally along the caudal edge of the eye. The distal nV innervates the imp and merges with both the contralateral nV and the distal tip of the seventh nerve (nVII) at the midline (H). Moreover neurons and axons of medial longitudinal fascicle (mlf), the Mauthner neurons (Mau) and neurons of the reticular formation (RoM1C, RoL1) express MDGA2A (F). (E,G) Isl-1 GFP staining in cranial motoneurons. As previously reported Isl-1 GFP transgenic zebrafish display intense cranial motoneurons V, VII and X staining (E). Moreover staining in the trigeminal as well as the facial nerve can easily be seen (G). Abbreviations: am, adductor hyomandibulae; cn, ciliary nerve; hh, hyohyal muscle; ih, interhyal muscle; ima, intermandibularis anterior; imp, intermandibularis posterior; Mau, mauthner neurons; nuc, mlf nucleus of the medial longitudinal fascicle; nV, trigeminal nerve (neurons); nVII, facial nerve (neurons); nX, vagal nerve (neurons); RoL1 and RoM1C, neurons of the reticular formation; sh, sternoid muscle. Scale bars equal 100µm. EXPRESSION / LABELING:
|

(A–D) MDGA2A staining in wt and MDGA2A knockdown zebrafish at 3dpf. Lateral views of MDGA2A labeled zebrafish demonstrate that antisense morpholino injections against MDGA2A efficiently downregulates the expression of MDGA2A. Neither MDGA2A positive hair cells along the otic vesicle (oc) nor the trigeminal nerve (asterisk) are stained in MDGA2A morphants (A,B). Also staining in the mlf and PLL is clearly downregulated (C,D). (E–H) Migration and axon outgrowth pattern of branchiomotoneurons in wt and MDGA2A knockdown zebrafish at 3dpf. In wt fish branchiomotoneurons occupy characteristic locations, with the trigeminal cluster being located in r2/r3 and the facial cluster lying adjacent to the midline (E). In MDGA2A morphants, trigeminal neurons settle at ectopic locations (arrow) (F). Moreover, staining intensity in the trigeminal (asterisk) and facial (arrowhead) nerve is strongly reduced in MDGA2A knockdown larva, suggesting that fewer axons are present in these nerve bundles. Abbreviations: ov otic vesicle; mlf medial longitudinal fascicle; PLL posterior lateral line fascicle; V trigeminal motoneurons; VII facial motoneurons; X vagal motoneurons. Scale bars in A,B, and E–H equal 50µm, in C,D 25µm. EXPRESSION / LABELING:
PHENOTYPE:
|
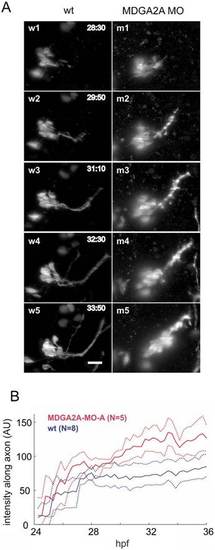
(A) Living isl-1 embryos were imaged by digital scanned laser light sheet microscopy from 24–36 hpf at 16min intervals. For analysis the images were deconvolved and the stacks were compressed into maximum projections. Representative images from control and MDGA2A morpholino treated embryos are shown. During the experimental period trigeminal neurons send out axons along a well-defined path, with no movement of the trigeminal neurons (w1–w5). In MDGA2A knockdown animals the compactness of the trigeminal cell cluster is impaired. Trigeminal neurons migrate along their axon bundles leaving their place of origin (bright dots along the axon bundle; m1–m5). (B) To quantify this migration phenotype, the time course of the fluorescence intensity along the trigeminal axon bundle was quantified in 8 control embryos and 5 MDGA2A morpholino treated embryos. Shown are the mean and bootstrap confidence intervals (as dotted lines, α = 0.05). Note that the fluorescence intensity along the trigeminal nerve in MDGA2A knockdown animals increases significantly past 30 hpf, representing the aberrant migration of trigeminal neurons. For more details see supplementary material Fig. S3A–C for individual intensity traces. The timestamp is hours post fertilization (h: min), N is the number of analyzed embryos, the scale bar is 20µm. |

Representative images from control (w) and MDGA2A morpholino treated (mA and mB) embryos are shown. 28 to 34h post fertilization facial neurons in wt embryos project axons along a predetermined path, displaying a well-documented 60° turn (asterisks). In MDGA2A morphants this turning angle is absent or strongly reduced and defasciculation events occur much more frequently. Analyzing fluorescence intensity below the main axon bundle of the facial nerve indicates that fluorescence in MDGA2A knockdown embryos is slightly increased, supporting the finding of increased defasciculation and axon branching of facial neurons (see supplementary material Fig. S3D–F). The scale bar represents 20µm. |