
- Title
-
The CXCR3/CXCL11 signaling axis mediates macrophage recruitment and dissemination of mycobacterial infection
- Authors
- Torraca, V., Cui, C., Boland, R., Bebelman, J.P., van der Sar, A.M., Smit, M.J., Siderius, M., Spaink, H.P., Meijer, A.H.
- Source
- Full text @ Dis. Model. Mech.
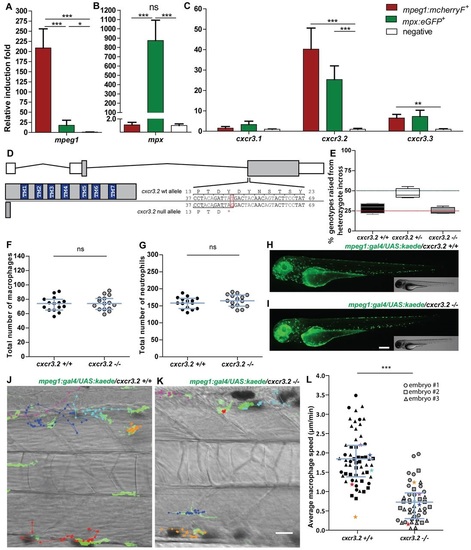
Characterization of cxcr3.2−/− embryos in unchallenged conditions. (A–C) Expression of cxcr3.2 and its paralogs cxcr3.1 and cxcr3.3 in FACS-sorted phagocytes. Graphs represent the relative induction fold of the macrophage marker mpeg1 (A), the neutrophil marker mpx (B), and of the cxcr3 paralogs (C) in FACS-sorted macrophages and neutrophils from the combined transgenic line Tg(mpeg1:mcherryF/mpx:eGFP) at 2 dpf. Expression of cxcr3.2 and cxcr3.3 could be detected in both macrophages and neutrophils, whereas cxcr3.1 was not significantly enriched in the FACS-sorted populations when compared with the non-labeled cell fraction. Sample size (n): five replicates. Errors bars: mean±s.e.m. Reference gene: eif4a1b. (D) Effect of the cxcr3.2 point mutation. Top: gene structure of cxcr3.2. Boxes represent exons, of which the gray parts correspond to the coding sequence. Bottom right: cxcr3.2 wild-type (wt) and mutant allele. A single T-to-G mutation at nucleotide 48 generates an early stop codon. Bottom left: consequence of cxcr3.2 mutation at the protein level. In cxcr3.2 mutant zebrafish, only a peptide of 15 amino acids can be translated, which lacks all the conserved transmembrane domains (TM1-7). Nucleotide and amino acid positions are enumerated from the translation start codon. (E) Normal viability of cxcr3.2−/− mutants. Percentage of genotypes deriving from cxcr3.2+/− incross. No significant deviation from the Mendelian 1:2:1 ratio was observed. The genotypes were evaluated on 122 adult fish from four independent breedings. The boxplots represent the area of the distributions between the first and the third quartiles. Whiskers represent the minimum and maximum end points of the distributions. (F,G) Quantification of macrophages and neutrophils. Combined Leukocyte-plastin (Lp) immunostaining and Myeloperoxidase (Mpx) staining were performed on cxcr3.2+/+ and cxcr3.2−/− embryos at 3 dpf and the numbers of stained cells residing in the caudal hematopoietic tissue were counted. Exclusively Lp-stained cells were considered as macrophages (F) and Lp/Mpx double-positive cells as neutrophils (G). No significant differences were detected. Total number of larvae (n) per group in both F and G: 15. Error bars: median and interquartile range. (H,I) Spatial distribution of macrophages. A macrophage-specific transgenic reporter driven by the mpeg1 promoter [Tg(mpeg1:gal4/UAS:kaede) (Ellett et al., 2011)] was crossed into the cxcr3.2 mutant background. Representative images of the resulting Tg(mpeg1:gal4/UAS:kaede) cxcr3.2+/+ (H) and cxcr3.2−/− (I) larvae at 3 dpf show no major differences in the macrophage distribution pattern. Scale bar: 200 μm. (J,K) Macrophage basal migratory capability. Paths of five representative macrophages in the trunk of Tg(mpeg1:gal4/UAS:kaede) cxcr3.2+/+ (J) and cxcr3.2−/− (K) larvae at 3 dpf. Mutant and wt larvae were mounted in agarose on the same dish and behavior of mutant and wt macrophages were simultaneously followed for 3 hours. Time-lapse images were taken every 6 minutes. The paths were followed and analyzed using ImageJ ManualTrack plugin. See also supplementary material Movies 1, 2. Scale bar: 20 μm. (L) Quantification of basal migration difference. The average speed of individual macrophages was calculated by tracking 15–21 macrophages from three different Tg(mpeg1:gal4/UAS:kaede) cxcr3.2+/+ and cxcr3.2−/− larvae (each larva is indicated with a different symbol) and was significantly reduced in cxcr3.2−/− macrophages. Total number of tracks (n): 61, 48. Error bars: mean and interquartile range. ns, non-significant; *P<0.05; ***P<0.001. PHENOTYPE:
|
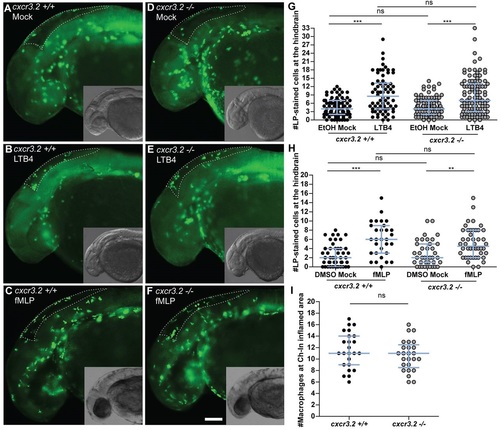
Macrophage chemoattraction by Cxcr3.2-independent factors. (A–H) Chemoattraction of macrophages by LTB4 and fMLP. cxcr3.2+/+ (A–C) and cxcr3.2−/− (D–F) embryos at 30 hpf were locally injected into the hindbrain cavity with 10.1 ng/ml (30 nM) LTB4 (representative images B and E) or with 0.2 mg/ml (0.5 mM) of fMLP (representative images C and F). Mock control injections with the solvents were 0.02% EtOH in PBS for the LTB4 treatment and 5% DMSO in PBS for the fMLP treatment (representative images A and D). Lp-stained cells accumulated in 3 hours within the hindbrain limits (dotted line) were counted as macrophages, as neutrophils do not significantly contribute to the total number of leukocytes recruited to the hindbrain at this developmental stage (supplementary material Fig. S3). LTB4 and fMLP stimulation resulted in significantly increased macrophage recruitment, compared with the mock injection, and this was independent of cxcr3.2 mutation (G,H). Scale bar in A–F: 100 μm. Data were accumulated from three independent experiments. Sample size (n) in G: 82, 70, 86, 100; Sample size (n) in H: 47, 30, 39, 46. Error bars: median and interquartile range. (I) Local macrophage recruitment to CuSO4 chemically-induced inflammation. Copper sulphate treatment was performed on 3 dpf embryos and macrophages accumulated in 3 hours at the damaged neuromasts of the lateral line were counted as Lp-stained cells minus Lp/Mpx double-positive cells, representing neutrophils. Similar numbers of macrophages were recruited to inflamed areas in both cxcr3.2+/+ and cxcr3.2−/− embryos. Sample size (n): 24, 25. Error bars: median and interquartile range. ns, non-significant; **P<0.01; ***P<0.001. PHENOTYPE:
|
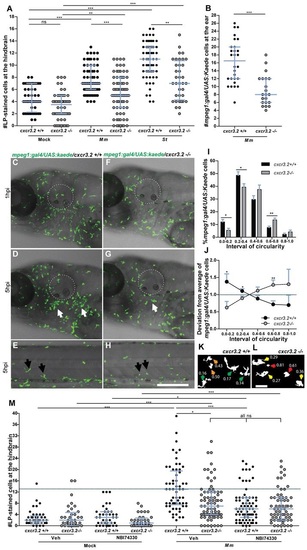
Cxcr3.2-dependent macrophage recruitment to localized bacterial infections. (A) M. marinum and S. typhimurium infection in the hindbrain ventricle. cxcr3.2+/+ and cxcr3.2−/− embryos were injected at 30 hpf with 200 CFU of M. marinum (Mm) or S. typhimurium (St), or mock injected with 2% polyvinylpyrrolidone-40 in PBS. Lp-stained cells accumulated in 3 hours within the hindbrain limits were counted as macrophages, because neutrophils do not significantly contribute to the total number of leukocytes recruited to the hindbrain at this developmental stage (supplementary material Fig. S3). Significant reduction of macrophage chemotaxis to infection is determined by cxcr3.2 mutation. Data were accumulated from two (St) or three (Mm) independent experiments. Sample size (n): 52, 52, 63, 75, 60, 36. Error bars: median and interquartile range. (B–H) Macrophage recruitment and systemic activation following M. marinum infection in the otic vesicle. Tg(mpeg1:gal4/UAS:kaede) cxcr3.2+/+ and Tg(mpeg1:gal4/UAS:kaede) cxcr3.2−/− larvae were injected with 200 CFU of M. marinum into the otic vesicle (dotted line) at 3 (B) or 4 (C–H) dpf. At 4 hpi of 3 dpf larvae, the accumulation of mpeg1:gal4/UAS:kaede-positive cells within the perimeter of the otic vesicle was reduced in cxcr3.2−/− larvae (B). Following injection at 4 dpf, macrophages are less able to penetrate the otic vesicle, but accumulate in the surrounding area (white arrows in D and G), as shown in representative time course movies (supplementary material Movies 3, 4) and stills from these movies at 1 hpi (C,F) and 5 hpi (D,G). A reduced accumulation was observed in the cxcr3.2 mutant. At a distal location in the trunk (E,H), macrophages seemed to show more frequently a branched morphology in cxcr3.2+/+ and a round morphology in cxcr3.2−/− (black arrows in E and H). Sample size (n) in B: 28, 21. Error bars: median and interquartile range. Scale bar in C–H: 250 μm. (I–L) Quantification of distal macrophage activation following local M. marinum infection. In order to quantify the distal activation of macrophages upon M. marinum infection, 200 CFU of bacteria were injected in the otic vesicle of 3 dpf mpeg1:gal4/UAS:kaede larvae. Images of the macrophages were acquired from the trunk of the infected larvae at 4 hpi and the circularity index (CI) of the distal macrophages was calculated. The graph in I represents the percentage of macrophages residing in the different intervals of CI, whereas the graph in J represents the divergence in distribution of the cxcr3.2+/+ and cxcr3.2−/− macrophages in the different classes of CI, calculated as the ratio between the percentage of cxcr3.2+/+ or cxcr3.2−/− macrophages in a certain CI interval and the overall mean percentage [(mutant + wt)/2] of macrophages in that interval (see Materials and Methods). Macrophages of cxcr3.2+/+ and cxcr3.2−/− larvae were distributed in a different fashion along the different classes, with the classes of high circularity more populated in the mutants and the classes of reduced circularity more populated in the wild type (wt). K and L show representative macrophages analyzed in I and J and their corresponding CI. Green arrows: 0.0≤CI<0.2; yellow arrows: 0.2≤CI<0.4; orange arrows: 0.4≤CI<0.6; red arrows: 0.6≤CI≤1.0. Sample size (n) in I–L: 390 cxcr3.2+/+ and 293 cxcr3.2−/− cells from 14 and 16 embryos, respectively. Error bars: mean±s.e.m. Scale bar in K,L: 40 μm. (M) Attenuation of macrophage recruitment to M. marinum via treatment with the CXCR3 antagonist NBI74330. cxcr3.2+/+ and cxcr3.2−/− embryos were bath-exposed to 50 μM NBI74330 or to vehicle only (Veh; 0.5% DMSO in medium) for 3 hours and then injected in the hindbrain ventricle at 30 hpf with mock or 200 CFU of Mm. Embryos were kept in NBI74330 or vehicle medium for an additional 3 hours and then collected for Lp immunostaining. Treatment with NBI74330 reduced the macrophage chemotaxis to infection in cxcr3.2+/+ embryos to similar levels as the vehicle-treated cxcr3.2−/− embryos, and no significant additive effect of cxcr3.2 mutation and NBI74330 treatment was observed. Data were accumulated from two independent experiments. Sample size (n): 41, 36, 39, 36, 61, 79, 73, 67. Error bars: median and interquartile range. ns, non-significant; *P<0.05; **P<0.01; ***P<0.001. PHENOTYPE:
|
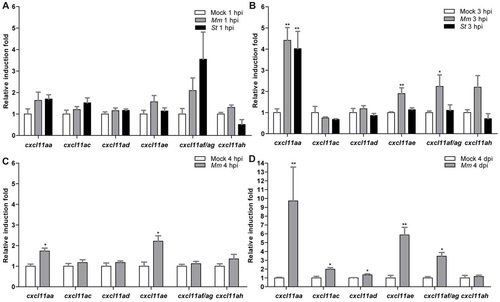
Inducibility of a subset of cxcl11-like genes upon bacterial infection. (A,B) Quadruplicate pools of 18–20 embryos infected in the hindbrain with 200 CFU of M. marinum (Mm) or S. typhimurium (St) at 30 hpf or mock-injected with PBS were collected at 1 hpi (A) and 3 hpi (B). A subset of CXCL11-like chemokine genes shows upregulation by qPCR in the infected groups, which becomes significant at 3 hpi. Error bars: mean±s.e.m. (C,D) Triplicate pools of 18–20 embryos systemically infected with M. marinum (Mm) at 1 dpf or mock-injected with PBS were collected at 4 hpi (C) and 4 dpi (D). Expression of cxcl11aa and cxcl11ae was significantly induced at both time points, whereas cxcl11ac, cxcl11ad and cxcl11af/ag were significantly induced only at 4 dpi. Error bars: mean±s.e.m. *P<0.05; **P<0.01. EXPRESSION / LABELING:
|

Macrophage chemoattraction by locally injected recombinant chemokines in cxcr3.2 mutant and wild-type siblings. Recombinant proteins or buffer (mock) were injected into the hindbrain ventricle at 30 hpf and macrophages accumulating in 3 hours within the hindbrain limits were counted as Lp-stained cells. Data were accumulated from three independent experiments. (A) Cxcl11aa (1.2 mg/ml). Sample size (n): 51, 60, 55, 60. (B) Cxcl11ae (0.5 mg/ml). Sample size (n): 54, 51, 42, 56. (C) Cxcl11af (0.5 mg/ml). Sample size (n): 47, 68, 39, 58. Error bars: median and interquartile range. Note that macrophage chemoattraction mediated by Cxcl11aa and Cxcl11af is abolished by cxcr3.2 mutation, whereas the chemoattraction mediated by Cxcl11ae is independent of cxcr3.2. ns, non-significant; **P<0.01; ***P<0.001. PHENOTYPE:
|
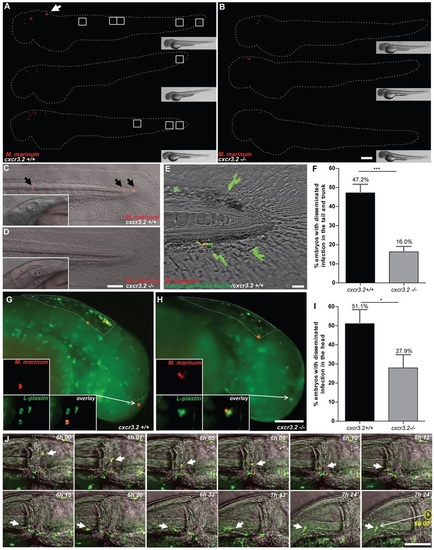
Effect of cxcr3.2 mutation on dissemination of local mycobacterial infection within 24 hpi. (A,B) Representative images of cxcr3.2+/+ and cxcr3.2−/− embryos with local and disseminated mycobacterial infection. Embryos were infected at 30 hpf by injecting 200 CFU of M. marinum into the hindbrain and images were taken at 24 hpi (54 hpf). In cxcr3.2+/+ embryos, single infected cells are visible distally from the infection (white boxes). Scale bar: 200 μm. (C–E) Details of distal infection emerging from hindbrain infection. The black arrows (C) point at single M. marinum-infected cells, present in the tail of a cxcr3.2+/+ fish at 24 hpi but notably absent in the example of a cxcr3.2−/− fish (D). Particulars of the infected hindbrains of the same embryos are shown in the boxed inserts on the left, indicating similar levels of local infection. Use of the Tg(mpeg1:gal4/UAS:kaede) line (E) shows that the infection disseminated from the hindbrain resides in macrophages in cxcr3.2+/+. Scale bars in C and D: 100 μm; scale bar in E: 20 μm. (F) Quantification of M. marinum infection dissemination in the trunk and tail in cxcr3.2+/+ and cxcr3.2−/− embryos. Embryos were scored positive for dissemination if one or more infected macrophages were observed in the trunk or tail region. The graph demonstrates a significant difference in the total percentage of embryos showing infection dissemination at 24 hpi. Data were accumulated from three independent experiments. Sample size (n): 125, 172. Error bars: mean±s.e.m. (G–I) Quantification of M. marinum infection dissemination in the head in cxcr3.2+/+ and cxcr3.2−/− embryos. Representative figures of cxcr3.2 wild-type (wt; G) and mutant (H) embryos and quantification (I) of dissemination in the head at 6 hours post M. marinum infection in the hindbrain. Embryos were scored positive for dissemination if one or more infected macrophages were observed outside the hindbrain limits (dotted line). Insets in G and H show details of infected macrophages outside the hindbrain. The graph in I demonstrates a significant difference in the total percentage of embryos showing infection dissemination at this time point. Arrows in the figures point at the particular of a disseminated infection. Sample size (n): 47, 43. Error bars: mean±s.e.m. Scale bar: 200 μm. (J) Time course of a M. marinum-infected macrophage egressing from the hindbrain. The image sequence (taken from a cxcr3.2+/+ embryo) represents over a time course of ~1.5 hours that macrophages (green) can facilitate the dissemination of M. marinum (red) that is locally delivered in the hindbrain ventricle. The dashed line in the first image represents the hindbrain limits and arrow points at an infected macrophages adhering to the hindbrain boundary. In the subsequent images the arrow points at the infected macrophage egressing from the hindbrain. The yellow circle in the last image of the sequence contains an inset of the infected macrophage from the first image to represent its initial position (6 hpi) compared with its position at the end of the image sequence (~7.5 hpi). Scale bar: 100 μm. *P<0.05; ***P<0.001. |

Effect of cxcr3.2 mutation on granuloma formation following systemic mycobacterial infection. (A–D) Representative images of granulomas in systemically infected cxcr3.2+/+ and cxcr3.2−/− larvae. Embryos were systemically infected at 1 dpf, injecting 200 CFU of M. marinum into the caudal vein. Images of three representative granuloma-like structures of wild-type (wt; A) or mutant (B) larvae were taken on samples fixed at 6 dpf and simultaneously stained for Lp and Mpx (TSA stain) to distinguish macrophages (Lp-positive, TSA-negative) from neutrophils (TSA-positive). Images of representative cxcr3.2+/+ (C) or cxcr3.2−/− (D) larvae were acquired live at 6 dpf. Scale bar in A,B: 40 μm. Scale bar in C,D: 200 μm. (E–G) Quantification of the impact of cxcr3.2 mutation on mycobacterial granuloma formation. Total infection burden (total infection fluorescent pixels; E), total number of bacterial clusters (F) and average area of bacterial clusters (G) are significantly reduced under cxcr3.2-deficient conditions. Data were accumulated from three independent experiments. Sample size (n): 170, 122. Error bars: median (E,F) or mean (G) and interquartile range. **P<0.01; ***P<0.001. |